KM Toolbox: Last Lecture on Operations Apprenticeship Program

The NJDOT Knowledge Management Toolbox offers examples of several knowledge sharing practices that have been, or could be, adopted by agency units to retain knowledge in a unit in the face of illness, retirements or transfers to other units at NJDOT.

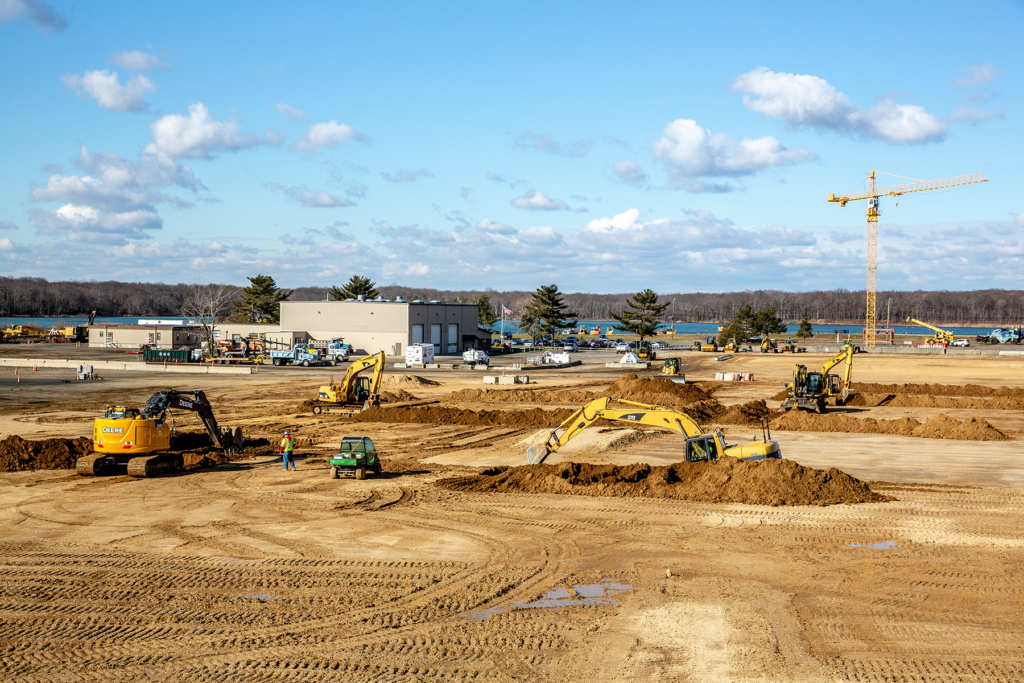
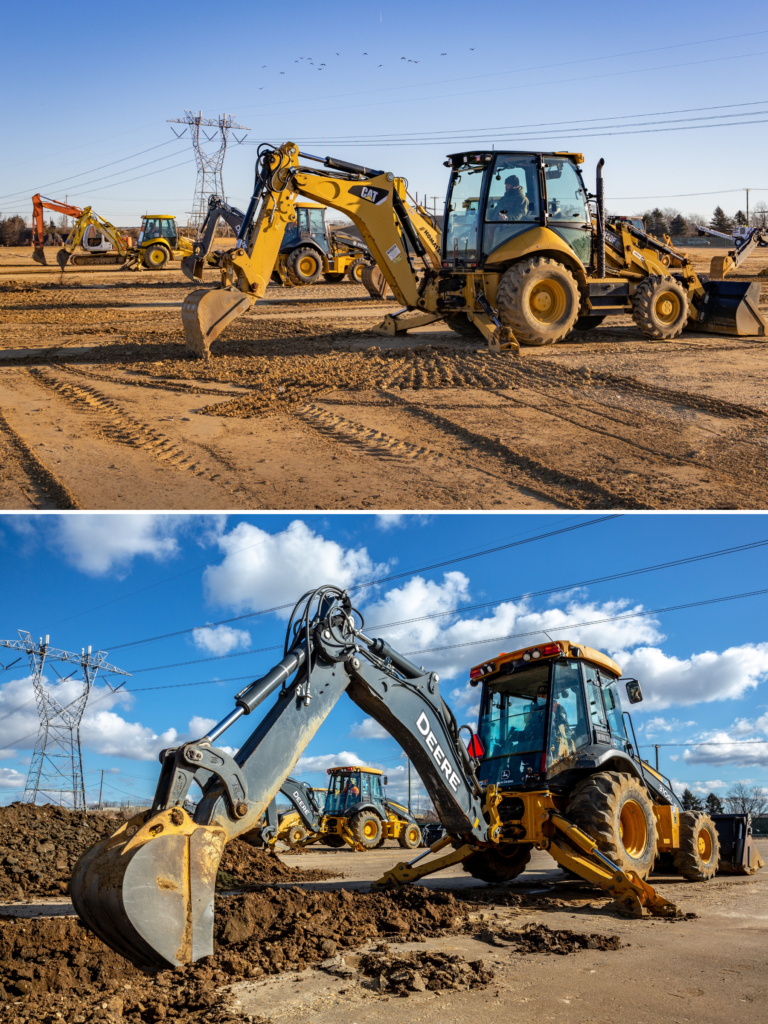
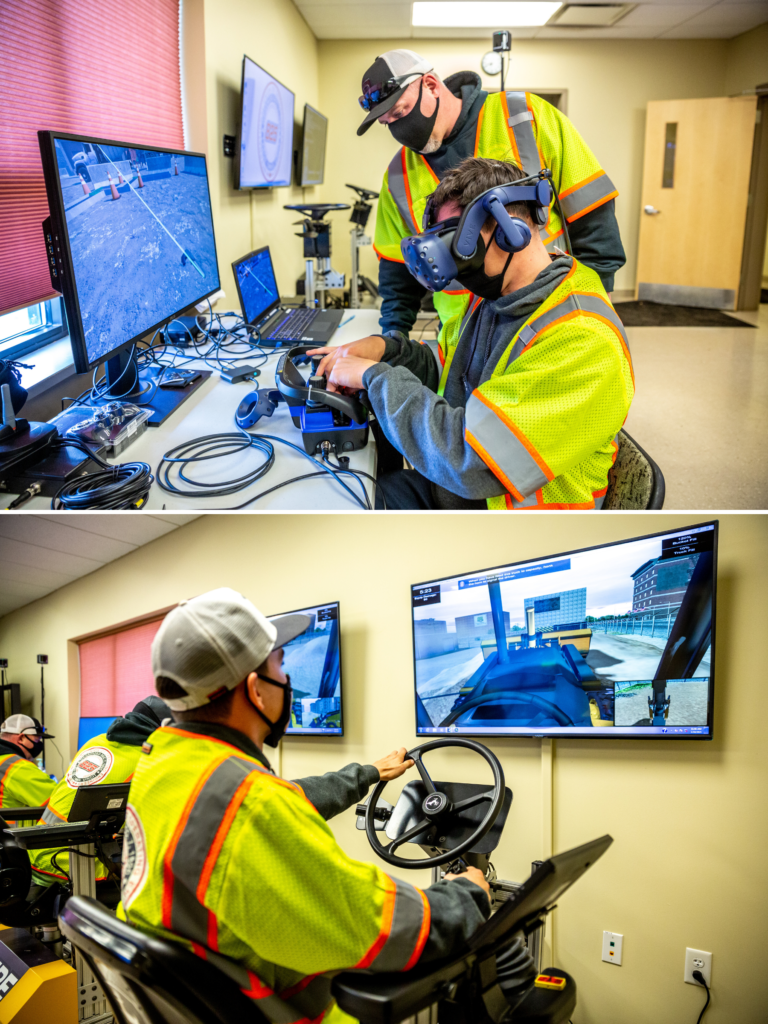
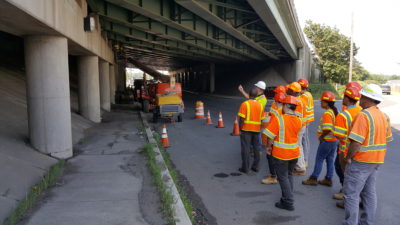
Highway operations crew members are now trained to do all types of work required.

Highway operations crew members are now trained to do all types of work required.

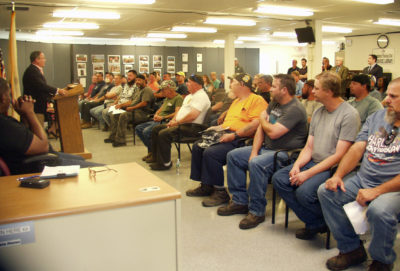
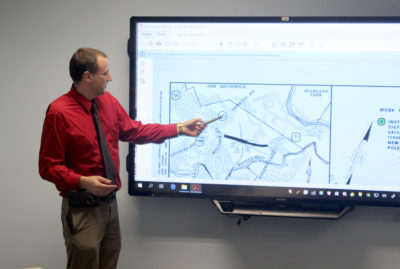
At the NJ STIC 2nd Quarter meeting, held on June 16, 2021, Michele Shapiro, Director, NJDOT Human Resources, presented on the Operations Apprenticeship Program as it relates to Strategic Workforce Development, an FHWA EDC-6 initiative. Ms. Shapiro retired from NJDOT in 2021 and her presentation serves as a Last Lecture, a knowledge sharing strategy that provides insight on a particular topic from an individual leaving an agency.

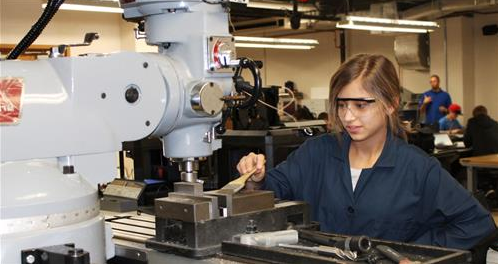
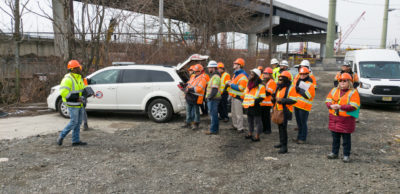
The Operations Apprenticeship Program began in 2014 as a way to provide consistent training and job skills among crew members in Highway Operations, and to establish a path to advancement for workers. The program was the brainchild of Andrew Tunnard, Asst. Commissioner, Transportation Operations Systems and Support. Ms. Shapiro worked with Mr. Tunnard to move away from a structure of specialty crews and have all employees trained to do all types of work required. They developed a job title structure and staffing profile for each crew, and identified a training team of Subject Matter Experts within Operations who designed curriculum for both on-the-job and classroom training. Entry-level positions in this program do not require specific education or skill sets. When individuals have proven competency on particular tasks, they are then eligible to apply to the next level. Employees can choose to stop their advancement at any point.

Employees have a path for advancement from entry-level trainee to supervisor.

Employees have a path for advancement from entry-level trainee to supervisor.

Human Resources worked with the NJ Civil Service Commission to allow hiring into entry-level trainee positions and advancement to Highway Operations Technician 1 (HOT 1) without a Civil Service Exam. Within this program, advancement to the HOT 2 level is dependent on a unique Civil Service-approved practical test to be administered by the DOT training team and NJDOT Human Resources staff. Ms. Shapiro offered a number of lessons learned from this ongoing initiative that Human Resources is applying to future efforts. They have received approval for an apprentice title for construction inspectors and will be developing training, and are working on training for the Engineering Technician program to ensure continual growth for these employees within the agency.

Ms. Shapiro's video presentation is available here:


RESOURCES

Knowledge Management Toolbox, Last Lecture. NJDOT Technology Transfer. Website. Retrieved at: https://www.njdottechtransfer.net/wp-content/uploads/2021/06/STIC-Q2-Feature-Presentation-Operations-Apprenticeship-Program.pdf


NJDOT UAS/Drone Procedures Manual and Best Practices for Use in New Jersey

The use of drones at NJDOT has expanded to improve safety and efficiency and save time and money.

The use of drones at NJDOT has expanded to improve safety and efficiency and save time and money.

The NJDOT Knowledge Management Toolbox offers examples of several knowledge sharing practices that have been, or could be, adopted by agency units to retain knowledge in a unit in the face of illness, retirements or transfers to other units at NJDOT.

NJDOT’s Unmanned Aircraft Systems Flight Operations Manual (UASFOM) is an example of knowledge sharing through development of a procedures manual that guides practice within the agency. In 2021, Anil Agrawal, PhD., a Professor of Engineering at The City College of CUNY, completed a research study, NJDOT UAS/Drone Procedures Manual and Best Practices for Use in New Jersey, funded through the NJDOT’s Bureau of Research. The study resulted in the UASFOM that standardizes all aspects of UAS operations for NJDOT’s use, and provides guidance to NJDOT personnel, consultants, and contractors for the inspection, operation, and management of UAS. The document emphasizes maintaining a high level of safety standards in daily flight operations while meeting performance targets.

NJDOT’s Bureau of Aeronautics has used drones to video NJDOT dredging operations, among other applications.

NJDOT’s Bureau of Aeronautics has used drones to video NJDOT dredging operations, among other applications.

Unmanned Aerial Systems (UAS), or drones, were promoted by the Federal Highway Administration (FHWA) as one of the Every Day Counts Round 5 (EDC-5) innovations. In May 2016, the New Jersey Department of Transportation’s Division of Multimodal Services established the Unmanned Aircraft Systems (UAS) Program as a unit within the Bureau of Aeronautics. Under the direction of NJDOT’s UAS Coordinator, Glenn Stott, NJDOT became a national leader in UAS. Mr. Stott retired from the agency in 2021.

NJDOT Bureau of Aeronautics used several funding grants to build the program and purchase equipment and provide training. Integrating UAS in transportation has been the subject of research and field studies to demonstrate the use case for high-mast light pole inspections, traffic incident management and monitoring, dredging and beach replenishment, photogrammetry, bridge inspection, and watershed management, among other topics. UAS has been shown to improve safety, save time and money and increase efficiency. UAS is considered to be institutionalized within NJDOT.

An example Risk Management Worksheet is one of several forms described in the Procedures Manual.

An example Risk Management Worksheet is one of several forms described in the Procedures Manual.

The procedures manual provides comprehensive guidance for UAS missions from planning to debriefing. The manual presents NJ’s laws and regulations affecting UAS operations, discusses NJDOT’s safety management system and risk management approach, established best practices, the agency’s three-phase training program, and incident reporting. The manual also provides NJDOT’s UAS forms needed for documentation and to ensure compliance with Federal Aviation Administration (FAA) regulations. The manual is intended to be a “living document” to incorporate changes as experience grows with UAS within the agency.

A procedures manual is one way to counter the loss of expertise and institutional knowledge when employees retire or transfer. A manual can build and sustain knowledge within the agency to ensure continuity of operations.

The UASFOM can be found in the Knowledge Management Toolbox. The Final Report and Technical Brief for the Research can be accessed here.

TAMS: New Management System Streamlines Multiple Databases

In August 2021, AASHTO recognized NJDOT's Transportation Asset Management System (TAMS) as a regional winner in the 2021 America's Transportation Awards Competitions in the "Best Use of Technology and Innovation" category. The article below, which first appeared in Transporter (Vol. 52, No. 3), an NJDOT employee newsletter, was entitled New Management System Streamlines Multiple Databases, One Man's Vision Becomes a Transformational Information Hub. The article was penned by the NJDOT Commissioner, Diane Gutierrez-Scacetti in recognition of the value of the innovation for NJDOT's operations.

Inspiration can come at any moment and in any place – even when ordering a sandwich at a local Wawa. Yes, that was when it struck Andrew Tunnard, Assistant Commissioner, Transportation Operations, Systems & Support (TOS&S), on how to revolutionize information sharing at NJDOT. While ordering lunch at the kiosk with Urvi Dave, formerly TOS&S Administrative Analyst 4, he shared his vision of creating a platform that would aggregate data from various units, and provide a menu of assets, much like the system that they were using to order lunch.

A drawn image of a road with an intersection, and bridges, with various parts, such as drainage inlet and traffic signal, showing the conceptual framework for what would become NJDOT's TAMS information management system

Andrew Tunnard, Assistant Commissioner, TOS&S, the visionary behind the TAMS system, shared his original concept graphic and stated, “This is a hand drawn depiction of the original concept of TAMS. It was meant to show the disparate asset management systems and how we had the potential to merge them into one system. The new system gives users visibility into work performed on all assets.”

This system would bridge all units, allowing data to be transparent, drive informed decision-making, and create pathways to efficiency. The system would provide complex datasets that are required for budgeting and cost analysis, helping to reduce costs and increase productivity. In short, the system would change the entire manner in which staff accessed and shared information. Urvi embraced the vision of a better solution and began brainstorming.

In October 2020, after years of planning and hundreds of work hours, NJDOT released the first iteration of the Transportation Asset Management System (TAMS). After a year of operation, TAMS is becoming the asset management hub that will transform the way we share Department information for years to come. The new system replaces the inefficient legacy Maintenance Management System (MMS) and numerous other software applications used by various units that made data sharing cumbersome and fact-finding a challenge.

What Is TAMS

TAMS is a Software as a Service (SaaS) solution that integrates all of the TOS&S maintenance assets into a single platform. TAMS provides field and office staff with a system that includes a menu of services, equipment, materials, locations and more that are used in their daily activities. It is accessible from any location, at any time, for data input, reporting and analyzing. Assets include labor, equipment, material, projects, budgets, all state owned and maintained roadways, electrical assets, bridges, and traffic signals, etc. More than 500,000 assets in approximately 64 categories are available in the TAMS menu.

Staff can input real-time data of all work activities from the field or office, including labor, materials, and equipment used for every maintenance project, with a date and time stamp of work begun and completed. This information goes into the Geographical Information System (GIS) with assets displayed on a map. When the user opens the asset on the map, it displays a before and after picture of the maintenance or project work completed, along with all of the other pertinent project information, providing a complete history from construction/installation to end of life in real- time.

Senior Management will now have easy access to all assets through the TAMS smart dashboard for reporting, planning, budgeting, and risk assessment. TAMS creates a synergy between staff of varying responsibilities by making data accessible to everyone in a manner that has never before existed in the Department. Using machine learning, the system will accumulate data enabling predictive asset maintenance and replacement scheduling. It will also allow repetitive problem locations to be identified, tracked, and addressed. Managing labor and allocating for overtime also will now be based on real-time data analysis. In addition, it will facilitate faster and more accurate report generation for Federal funding reimbursement.

TAMS Today

An Emergency Call Records form (EL-15) often mobilizes TOS&S staff when maintenance is required. The TAMS platform integrates the EL-15 form allowing for the tracking of all activities including labor and equipment costs, weather and special events, while providing GIS location and images.

TAMS by the Numbers Since Launch:

  • Activity Reports: Nearly 90,560 daily activity reports have been entered into the platform
  • Potential Claims: Nearly 4,050 activity reports have been identified by field crews as potential claims for reimbursement with the newly added early detection TOS&S functionality.
  • Major Events: Nearly 44 major weather events have been recorded.
  • Emergency Call Records (EL-15 records): More than 30,295 EL-15 reports have been documented.
  • Public Problem Reports: 4,219 Public Problem Reports (PPR) have been submitted and administered by the Central Dispatch Unit and acted on by field crews. This is a 14% increase in public reporting from the prior system. PPR replaced the public Pothole Hotline webpage.

The Future of TAMS

TAMS is scalable to other units and will provide all designated staff with platform access, allowing cross-unit data input and retrieval. The cross-unit platform will create an easy, efficient and transparent tool that will make the entire Department more efficient and productive.

Stronger, More Resilient Bridges: Ultra High-Performance Concrete (UHPC) Applications in New Jersey

UHPC for Bridge Preservation and Repair is a model innovation in the latest round of the FHWA’s Every Day Counts Program (EDC-6).  UHPC is recognized as an innovative new material that can be used to extend the life of bridges. Its enhanced strength reduces the need for repairs, adding to the service life of a facility.   

This Q&A article has been prepared following correspondence with Pranav Lathia, an NJDOT Supervising Engineer, Structural & RR Engineering Services, to learn more about current initiatives to test and deploy UHPC on the Garden State’s bridges. The Q&A correspondence has been edited for clarity.


Q. What is Ultra High Performance Concrete (UHPC), and why is it particularly useful for bridge preservation and repair (P&R)?

Ultra High Performance Concrete (UHPC) is a new class of concrete which contains extraordinary properties of durability and strength. UHPC is a cement based composite material, which consists of steel fiber reinforcement, cement, fine sand, and other admixtures. UHPC is a useful alternative for bridge repairs and preservation due to its long-term durability, which will minimize repairs to a specific structure over time.

Q. Why, in some cases, is UHPC a better application than traditional treatments?

Due to its chemical properties UHPC has a compressive strength of seven times that of regular concrete. Therefore, UHPC is mostly used for thin overlays, closure pours, link slabs, beam end repairs and joint headers.

Q. What are some advantages of UHPC?

UHPC overlays appear to have many ideal properties for deck surface, including superior bond strength, compressive strength, lower permeability, greater freeze-thaw damage resistance, good abrasion resistance, and rapid cure times, among others.

Q. What are some disadvantages to UHPC?

There are some disadvantages to UHPC.  UHPC has higher material costs which has to be a factor in the Department's decision process. A life-cycle cost analysis is appropriate for making a determination of whether it is a cost-effective alternative for the Department.  Fresh UHPC does not bond well to hardened UHPC, therefore careful consideration for joint construction is needed, including reinforced staging joints. There is also limited test data for construction materials to determine their ability to perform well with UHPC. In addition, the NJ construction workforce is not very familiar with the use of UHPC as an overlay.

Image of a red rectangular device that works to smooth the UHPC,

Figure 1: It is imperative that contractors establish the proper amount of UHPC fluidity to maintain the bridge deck’s grade. Courtesy of NJDOT.

Q. When is UHPC perhaps not an appropriate solution?

UHPC would not be an appropriate solution for a full deck replacement, superstructure replacement, or total replacement.

Q. What are some examples of UHPC’s previous implementations?

Before our initiation of a pilot program, UHPC had only been used for ABC (closure pours) and pre-cast connections in New Jersey since 2014.

 Q. How is NJDOT approaching the potential implementation of UHPC for bridge preservation and replacement (P&R)?

Currently NJDOT uses UHPC ABC (closure pours) for prefabricated superstructures. NJDOT has launched and implemented a UHPC Overlay Research Project in conjunction with the design engineering firm, WSP Solutions.

Q. Can you describe the how UHPC is applied in the pilot project for P&R?

In the pilot project, a 1.5” UHPC overlay has been applied to four NJDOT structures. The UHPC overlay was constructed on the bridge deck along with the reconstruction of deteriorated deck joints.

Q. What bridges were selected, and what was the rationale for their selection?

Four structures were chosen for the UHPC overlay pilot program and split into two separate contracts, Contract A (North) and Contract B (South):

  • I-295 NB & US 130 NB over Mantua Creek in West Deptford, Gloucester County
  • NJ 57 over Hances Brook in Mansfield, Warren County
  • I-280 WB over Newark Turnpike in Kearny, Hudson County
  • NJ 159 WB over Passaic River in Montville, Morris County

The selected bridges for the pilot program were in good condition to leverage the perceived long life-span of UHPC and not allow other factors to limit the potential service life. Eight candidate structures were fully evaluated and tested before the four structures were advanced. The bridges that were ultimately selected varied in their age, size and design. All the bridges had asphalt overlay.

Q. What were the evaluation criteria used for the selection of the pilots?

All structures included in the program were evaluated for suitability based on the structural evaluations, chloride content within the deck, feasible construction stages, traffic analysis results, and existing overlay depths. Chloride content was obtained from the concrete cores we had completed on each bridge deck.

Q. What best practices were learned from the pilot projects?

It was best to install the UHPC overlays in locations that UHPC would serve as the final riding surface. The Department felt that an UHPC overlay should be constructed on structures which had an existing asphalt overlay. A thinner overlay could have been provided to cut material costs. Using a pan mixer, the supplier had the ability to control the fluidity of the UHPC, which is extremely important when dealing with extreme temperatures and high deflection/ movement structures. A flow test should continue to be required to verify the proper mixing and consistency of the UHPC overlay material.

Q. Were there any innovations from the implementation of the pilot projects?

A deeper overlay could be considered as a viable alternative for structures that need major deck rehabilitation or replacement.

A bridge with a plastic cover at night, waiting for the UHPC to cure

Figure 2. An NJDOT UHPC treatment in the process of curing. Courtesy of NJDOT.

Q. How is data from the pilots being used to research further UHPC applications?

The data from the pilot program will be used to further the Department’s investigation in UHPC for applications other than just bridge deck overlays.

Q.  What can be done to prepare industry and the workforce for UHPC as an overlay?

The implementation of UHPC affects the current workforce because it is a new material to be used in New Jersey. The current workforce does not have enough experience with UHPC’s properties which could make a repair more challenging.  UHPC has only been used for closure pours in New Jersey. This knowledge gap could be solved by supplying the workforce with workshops, seminars, and suggested construction sequences, practices and equipment. A test slab should also be constructed to verify the proposed material and the contractor’s procedures.

Q. Are there needed actions to better educate NJDOT staff on its efficacy and potential uses?

Yes, training and peer exchange activities are valuable for further educating NJDOT staff on UHPC. Recently, we participated in a a two-day UHPC workshop (October 2021) with the U.S. Department of Transportation. The workshop provided participants with a greater understanding of what UHPC is, and explored solutions for using UHPC for bridge deck overlays, link slabs, and steel girder end repairs. Participants were given information on where to obtain guidance for implementing different types of UHPC preservation and repair strategies. The workshop also provided participants with the opportunity to discuss their UHPC implementation strategy, construction specifications, and design details with FHWA EDC-6 UHPC team members.

Image of a bridge with a new white smooth UHPC application on top.

Figure 3. The final product, a UHPC overlay before asphalt paving. Courtesy of NJDOT.

Q. What does the future of UHPC look like in New Jersey?

The future of UHPC in New Jersey could consist of UHPC connection repairs, seismic retrofits, column repairs, concrete patching, shotcrete, steel girder strengthening, bridge deck overlays, and link slabs.

Q. In the current EDC-6 Round, the NJ STIC states that it is planning on performing an assessment of the UHPC pilot projects. When they are complete, how will they be assessed? Could you tell us more about the long-term testing program being developed to gather performance data in the assessment phase?

These are still works in progress. A long-term monitoring and testing program is being developed to gather performance data in the assessment phase. The scope of our current efforts includes further investigation and research, collection and evaluation of performance data, updating the standard specifications and conducting a life cycle cost analysis.

Q. Can you describe the objective(s) and/or provide any other status information about the long-term program goals?

A long-term goal for the department is to incorporate UHPC into our design manual, including for P&R.Eventually we could see UHPC incorporated with bridge deck overlays and concrete bridge repairs. There is currently no timeline on incorporating UHPC into the design manual. We anticipate revising the standard specifications, but there are no updates regarding the revision of the standard specifications for UHPC.


Resources

Federal Highway Administration. (2019, February). Design and Construction of Field-Cast UHPC Connections. Federal Highway Administration. https://www.fhwa.dot.gov/publications/research/infrastructure/structures/bridge/uhpc/19011/index.cfm

Federal Highway Administration. (2020, November). Eliminating Bridge Joints with Link Slabs—An Overview of State Practices. Federal Highway Administration. https://www.fhwa.dot.gov/bridge/preservation/docs/hif20062.pdf

Federal Highway Administration. (2018, April). Example Construction Checklist: UHPC Connections for Prefabricated Bridge Elements. Federal Highway Administration. https://www.fhwa.dot.gov/bridge/abc/docs/uhpc-construction-checklist.pdf

Federal Highway Administration. (2018, March). Properties and Behavior of UHPC-Class Materials. Federal Highway Administration. https://www.fhwa.dot.gov/publications/research/infrastructure/structures/bridge/18036/18036.pdf

Federal Highway Administration. (2018, February) Ultra-High Performance Concrete for Bridge Deck Overlays. Federal Highway Administration. https://www.fhwa.dot.gov/publications/research/infrastructure/bridge/17097/index.cfm

Mendenhall, Jess and Rabie, Samer. (2021, October 20). UHPC Overlays for Bridge Preservation—Lessons Learned. New Jersey Department of Transportation. https://www.njdottechtransfer.net/wp-content/uploads/2021/11/NJDOT-UHPC-Overlay-Research-Project-EDC-6-Workshop.pdf

New Jersey Department of Transportation. (2021, October 20). NJDOT Workshop Report. New Jersey Department of Transportation. https://www.njdottechtransfer.net/wp-content/uploads/2021/11/NJDOT-UHPC-Workshop-Final-Report.pdf

New Mexico Department of Transportation. (2010). Feasibility Analysis of Ultra High Performance Concrete for Prestressed Concrete Bridge Applications. New Mexico Department of Transportation. https://rosap.ntl.bts.gov/view/dot/24640

New York State Department of Transportation. (2021, June). Item 557. 6601NN16 – Ultra-High Performance Concrete (UHPC). New York State Department of Transportation. https://www.dot.ny.gov/spec-repository-us/557.66010116.pdf

From left to right, image of a camera on a traffic pole, AI computer vision vehicle traveling paths, and AI identifying cars on an interstate, using colored boxes

How Automated Video Analytics Can Make NJ’s Transportation Network Safer and More Efficient

Computer vision is an emerging technology in which Artificial Intelligence (AI) reads and interprets images or videos, and then provides that data to decision makers. For the transportation field, computer vision has broad implications, streamlining many tasks that are currently performed by staff. By automating monitoring procedures, transportation agencies can gain access to improved, real-time incident data, as well as new metrics on traffic and “near-misses,” which contribute to making more informed safety decisions.

To learn more about the how computer vision technology is being applied in the transportation sector, three researchers working on related projects were interviewed: Dr. Chengjun Liu, working on Smart Traffic Video Analytics and Edge Computing at the New Jersey Institute of Technology; Dr. Mohammad Jalayer, developing an AI-based Surrogate Safety Measure for intersections at Rowan University, and Asim Zaman, PE, currently researching how computer vision can improve safety for railroads. All researchers expressed that this technology is imminent, effective, and will affect staffing needs and roles at transportation agencies.   

A summary of these interviews is presented below.


Smart Traffic Video Analytics (STVA) and Edge Computing (EC) – Dr. Chengjun Liu, Professor, Department of Computer Science, New Jersey Institute of Technology

Dr. Chengjun Liu is a professor of computer science at the New Jersey Institute of Technology, where he leads the Face Recognition and Video Processing Lab. In 2016, NJDOT and the National Science Foundation (NSF) funded a three and-a-half year research project The project led to the development of several promising tools, including a Smart Traffic Video Analysis (STVA) system that automatically counts traffic volume, and detects crashes, traffic, slowdowns, wrong-way drivers, and pedestrians, and is able to classify different types of vehicles.

“There are a number of core technologies involved in these smart traffic analytics.” Dr. Liu said. “In particular, advanced video analytics. Here we also use edge computing because it can be deployed in the field. We also apply some deep learning methods to analyze the video.”

Video image of interstate highway with bidirectional traffic and AI identifying vehicles using green and red boxes

Figure 1. A video feed shows the AI identifying passing vehicles on I-280 in real-time. Courtesy of Innovative AI Technologies.

To test this technology, Dr. Liu’s team developed prototypes to monitor traffic in a real-world setting. The prototype consists of Video Analytics (VA)  software, and Edge Computing (EC) components. EC is a computing strategy that seeks to reduce data transmission and response times by distributing computational units, often in the field. In this case, VA and EC systems, consisting of a wired camera with a small computer attached, were placed to overlook segments of both Martin Luther King Jr. Boulevard and I-280 in Newark. Footage shows the device detecting passing cars, counting and classifying vehicles as they enter a designated zone. Existing automated technologies for traffic counting had something in the realm of a 20 to 30 percent error rate, while Dr. Liu reported error rates between 2 and 5 percent.

Additional real-time roadway footage from NJDOT shows several instances of the device flagging aberrant vehicular behavior. On I-280, the system flags a black car stopped on the shoulder with a red box. On another stretch of highway, a car that has turned left on a one-way is identified and demarcated. The same technology, being used for traffic monitoring video in Korea, immediately locates and highlights a white car that careens into a barrier and flips. Similar examples are given for congestion and pedestrians.

“This can be used for accident detection, and traffic vehicle classification, where incidents are detected automatically and in real time. This can be used in various illumination conditions like nighttime, or weather conditions like snowing, raining, and so forth.” Dr. Liu said.

According to Dr. Liu, video monitoring at NJDOT is being outsourced, and it might take days, or even weeks, to review and receive data. Staff monitor operations via video monitors from NJDOT facilities, where, due to human capacity constraints, some incidents and abnormal driving behavior go unnoticed. Like many tools using computer vision, the STVA system can provide live metrics, allowing for more effective monitoring than is humanly possible and accelerating emergency responder dispatch times.

STVA, by automating some manned tasks, would change workplace needs in a transportation agency. Rather than requiring people to closely monitor traffic and then make decisions, use of this new technology would require staff capable of working with the software, troubleshooting its performance, and interpreting the data provided for safety, engineering, and planning decisions.

Dr. Liu was keen to see his technology in use, expressing how the private sector was already deploying it in a variety of contexts. In his view, it was imperative that STVA be implemented to improve traffic monitoring operations. “There is a potential of saving lives,” Dr. Liu said.


Safety Analysis Tool - Dr. Mohammad Jalayer, Associate Professor, Civil and Environmental Engineering, Rowan University

Dr. Mohammad Jalayer, an associate professor of civil and environmental engineering at Rowan University, has been researching the application of computer vision to improving safety at intersections. While Dr. Liu’s STVA technology might focus more heavily on real-time applications, Dr. Jalayer’s research looks to use AI-based video analytics to understand and quantify how traffic functions at certain intersections and, based on that analysis, provide data for safety changes.

Traditionally, Dr. Jalayer said, safety assessments are reactive, “meaning that we need to wait for crashes to happen. Usually, we analyze crashes for three years, or five years, and then figure out what’s going on.” Often, these crash records can be inaccurate, or incomplete. Instead, Dr. Jalayer and his team are looking to develop proactive approaches. “Rather than just waiting for a crash, we wanted to do an advanced analysis to make sure that we prevent the crashes.”

Because 40 percent of traffic incidents occur at intersections, many of them high-profile crashes, the researchers chose to focus on intersection safety. For this, they developed the Safety Analysis Tool.

Image of an intersection with overlays of different colors, showing vehicle paths as they drive past, demonstrating different travel paths

Figure 2. The Surrogate Safety Analysis in action, using user behavior to determine recurring hazards at intersections. Courtesy of Dr. Jalayer.

The Surrogate Safety Measure analyzes conflicts and near-misses. The implementation of a tool like the Surrogate Safety Measure will help staff to make more informed safety decisions for the state’s intersections. The AI-based tool uses a deep learning algorithm to look at many different factors: left-turn lanes, traffic direction, traffic count, vehicle type, and can differentiate and count pedestrians and bicycles as well.

The Safety Analysis Tool’s Surrogate Safety Measure contains two important indicators: Time To Collision (TTC), and Post-Encroachment Time (PET). These are measures of how long it would take two road users to collide, unless further action is taken (TTC), and the amount of time between vehicles crossing the same point (PET), which is also an effective indicator of high-conflict areas.

In practice, these metrics would register, for example, a series of red-light violations, or people repeatedly crossing the street when they should not. Over time, particularly hazardous areas of intersections can be identified, even if an incident has not yet occurred. According to Dr. Jalayer, FHWA and other traffic safety stakeholders have already begun to integrate TTC and PET into their safety analysis toolsets.

Additionally, the AI-based tool can log data that is currently unavailable for roadways. For example, it can generate accurate traffic volume reports, which, Dr. Jalayer said, are often difficult to find. As bicycle and pedestrian data is typically not available, data gathered from this tool would significantly improve the level of knowledge about user behavior for an intersection, allowing for more effective treatments..

In practice, after the Safety Analysis Tool is applied, DOT stakeholders can decide which treatment to implement. For example, Jalayer said, if the analysis finds a lot of conflict with left turns at the intersection, then perhaps the road geometry could be changed. In the case of right-turn conflicts, a treatment could look at eliminating right turns on red. Then, Jalayer said, there are longer-term strategies, such as public education campaigns.

Image of Safety Analysis Tool interactive box with parts that read Analysis and Video, with Results, such as Vehicle Red Light Violation

Figure 3. The Safety Analysis tool user interface, which can run various analyses of traffic video, such as vehicle violations, or pedestrian volume. Courtesy of Dr. Jalayer.

For the first phase of the project, the researchers deployed their technology at two intersections in East Rutherford, near the American Dream Mall. For the current second phase, they are collecting data at ten intersections across the state, including locations near Rowan and Rutgers universities.

Currently, this type of traffic safety analysis is handled in a personnel-intensive way, with a human physically present studying an intersection. But with the Surrogate Safety tool, the process will become much more efficient and comprehensive. The data collected  will be less subject to human error, as it is not presently possible for staff to perfectly monitor every camera feed at all times of day.

This technology circumvents the need for additional staff, removing the need for in-person field visits or footage monitoring. Instead of staff with the advanced technical expertise to analyze an intersection’s safety in the field, state agencies will require personnel proficient in maintaining the automated equipment.

Many state traffic intersections are already equipped with cameras, but the data is not currently being analyzed using computer vision methods. With much of the infrastructure already present, Dr. Jalayer said that the next step would be to feed this video data into their software for analysis. There are private companies already using similar computer-vision based tools. “I believe this is a very emerging technology, and you're seeing more and more within the U.S.,” Dr. Jalayer said. He expects the tool to be launched by early 2022. The structure itself is already built, but the user interface is still under development. “We are almost there.” Dr. Jalayer said.


AI-Based Video Analytics for Railroad Safety – Asim Zaman, PE, Project Engineer, Artificial Intelligence / Machine Learning and Transportation research, Rutgers University

Asim Zaman, a project engineer at Rutgers, shared information on an ongoing research project examining the use of computer analytics for the purpose of improving safety on and around railways. The rail safety research is led by Dr. Xiang Liu, a professor of civil and environmental engineering at Rutgers Engineering School, and involves training AI to detect  trespassers on the tracks, a persistent problem that often results in loss of life and serious service disruptions. “Ninety percent of all the deaths in the railroad industry come from trespassing or happen at grade crossings,” Zaman said.

The genesis of the project came from Dr. Liu hypothesizing that, “There's probably events that happen that we don't see, and there's nothing recorded about, but they might tell the full story.” Thus, the research team began to inquire into how computer vision analysis might inform targeted interventions that improve railway safety.

Figure showing three vehicles driving over railroad tracks, with color overlays showing that they are detected by the AI

Figure 4. The color overlay of vehicles trespassing on railways demonstrates that the AI has successfully detected them. Courtesy of Zaman, Ren, and Liu.

Initially, the researchers gathered some sample video, a few days' worth of footage along railroad tracks, and analyzed it using simple artificial intelligence methods to identify “near-miss events,” where people were present on the tracks as a train approached, but managed to avoid being struck. Data on near-misses such as these are not presently recorded, leading to a lack of comprehensive information on trespassing behavior.

After publishing a paper on their research, the team looked into integrating deep learning neural networks into  the analysis, which can identify different types of objects. With this technology, they again looked at trespassers, using two weeks of footage this time. This study was effective, but still computationally-intensive. For their next project, with funding from the Federal Railroad Administration (FRA), they looked at the efficacy of applying a new algorithm, YOLO (You Only Look Once), to generate a trespassing database.

The algorithm has been fed live video from four locations over the past year, beginning on January 1, 2021, and concluding on December 31. Zaman noted that, with the AI’s analysis and the copious amounts of data, the research can begin to ask more granular questions such as, “How many trespasses can we expect on a Monday in winter? Or, what time of day is the worst for this particular location? Or, do truck drivers trespass more?”

Image of computer vision tool detecting pedestrians on tracks as train is actively using intersection, they are shown highlighted in green

Figure 5. Similar work shows AI identifying and flagging pedestrian trespassers. The researchers are currently working on using unreported “near-miss” data to improve safety. Courtesy of Zaman, Ren, and Liu.

After the year’s research has concluded, the researchers will study the data and look for applications. Without the AI integration, however, such study would be time-consuming and impractical. The applications fall under the “3E” categories: engineering, education, and enforcement. For example, if the analysis finds that trespassing tends to happen at a particular location at 5pm, then that might be when law enforcement are deployed to that area. If many near-misses are happening around high school graduation, then targeted education and enforcement would be warranted during this time. But without this analysis, no measures would be taken, as near-misses are not logged.

Currently, this type of technology is in the research stage. “We're kind of in the transition between the proof of concept and the deployment here,” Zaman said. The researchers are focused on proving its effectiveness, with the goal of enabling railroads and transit agencies to use these technologies to study particularly problematic areas, and determine if treatments are working or if additional measures are warranted. “It's already contributing, in a very small way, to safety decision making.”

Zaman said that the team at Rutgers was very interested in sharing this technology, and its potential applications, with others. In his estimation, these computer analytics are about five years from a more widespread rollout. He notes that this technology would be greatly beneficial as a part of transportation monitoring, as “AI can make use out of all this data that’s just kind of sitting there or getting rinsed every 30 days.”

Applying computer vision to existing video surveillance will help to address significant safety issues that have persistently affected the rail industry. The AI-driven safety analysis will identify key traits of trespassing that have been previously undetected, assisting decision makers in applying an appropriate response. As with other smart video analytics technologies, the benefit, lies in the enhanced ability to make informed decisions that save lives and keep the system moving.


Current and Future Research

The Transportation Research Board’s TRID Database provides recent examples of how automated video analytics are being explored in a wider context. For example, in North Dakota, an in-progress project, sponsored by the University of Utah, is studying the use of computer vision to automate the work of assessing rural roadway safety. In Texas, researchers at the University of Texas used existing intersection cameras to analyze pedestrian behavior, publishing two papers on their findings.

The TRID database also contains other recent research contributions to this emerging field. The article, “Assessing Bikeability with Street View Imagery and Computer Vision(2021) presents a hybrid model for assessing safety, applying computer vision to street view imagery, in addition to site visits. The article, "Detection of Motorcycles in Urban Traffic Using Video Analysis: A Review" (2021), considers how automatic video processing algorithms can increase safety for motorcyclists.

Finally, the National Cooperative Highway Research Program (NCHRP) has plans to undertake a research project, Leveraging Artificial Intelligence and Big Data to Enhance Safety Analysis once a contractor has been selected. This study will develop processes for data collection, as well as analysis algorithms, and create guidance for managing data. Ultimately, this work will help to standardize and advance the adoption of AI and machine learning in the transportation industry.

The NCHRP Program has also funded workforce development studies to better prepare transportation agencies for adapting to this rapidly changing landscape for transportation systems operations and management.  In 2012, the NCHRP  publication, Attracting, Recruiting, and Retaining Skilled Staff for Transportation System Operations and Management, identified the growing need for transportation agencies to create pipelines for system operations and management (SOM) staff, develop the existing workforce with revamped trainings, and increase awareness of the field’s importance for  leadership and the public.  In 2019, the Transportation Systems Management and Operations (TSMO) Workforce Guidebook further detailed specific job positions required for a robust TSMO program.  The report considered the knowledge, skills, and abilities required for these job positions and tailored recommendations to hiring each position. The report compiled information on training and professional development, including specific training providers and courses nationwide.


Conclusion

Following a brief scan of current literature and Interviews with three NJ-based researchers, it is clear that computer vision is a broadly applicable technology for the transportation sector, and that its implementation is imminent. It will transform aspects of both operations monitoring, and safety analysis work, as AI can monitor and analyze traffic video far more efficiently and effectively than human staff. Workplace roles, the researchers said, will shift to supporting the technology’s hardware in the field, as well as managing the software components.  Traffic operations monitoring might transition to interpreting and acting on incidents that the Smart Traffic Video Analytics flags. Engineers, tasked with analyzing traffic safety and determining the most effective treatments, will be informed by more expansive data on aspects such as driver behavior and conflict areas than available using more traditional methods.

The adoption of computer vision in the transportation sector will help to make our roads, intersections, and railways safer. It will help transportation professionals to better understand the conditions of facilities they monitor, providing invaluable insight for how to make them safer, and more efficient for all users. Most importantly, these additional metrics will provide ways of seeing how people behave within our transportation network, often in-real time, enabling data-driven interventions that will save lives.

State, regional and local transportation agencies will need to recruit and retain staff with the right knowledge, skills and abilities to capture the safety and operations benefits and navigate the challenges of adopting new technologies in making this transition.


Resources

Center for Transportation Research. (2020). Video Data Analytics for Safer and More Efficient Mobility. Center for Transportation Research. https://ctr.utexas.edu/wp-content/uploads/151.pdf

City of Bellevue, Washington. (2021). Accelerating Vision Zero with Advanced Video Analytics: Video-Based Network-Wide Conflict and Speed Analysis. National Operations Center of Excellence. https://transops.s3.amazonaws.com/uploaded_files/City%20of%20Bellevue%2C%20WA%20-%20Conflict%20and%20Speed%20Analysis%20-%20NOCoE%20Case%20Study.pdf

Espinosa, J., Velastín, S., and Branch, J. (2021). "Detection of Motorcycles in Urban Traffic Using Video Analysis: A Review," in IEEE Transactions on Intelligent Transportation Systems, Vol. 22, No. 10, pp. 6115-6130, Oct. 2021. https://ieeexplore.ieee.org/document/9112620

Ito, Koichi, and Biljecki, Filip. (2021). “Assessing Bikeability with Street View Imagery and Computer Vision.Transportation Research Part C: Emerging Technologies.  Volume 132, November 2021, 103371. https://doi.org/10.1016/j.trc.2021.103371

Jalayer, Mohammad, and Patel, Deep. (2020). Automated Analysis of Surrogate Safety Measures and Non-compliance Behavior of Road Users at Intersections. Rowan University. https://www.njdottechtransfer.net/wp-content/uploads/2020/11/Patel-Jalayer-with-video.pdf

Liu, Chengjun (2021). Stopped Vehicle Detection. New Jersey Institute of Technology. https://web.njit.edu/~cliu/NJDOT/DEMOS.html

Liu, X., Baozhang, R., and Zaman, A. (2019). Artificial Intelligence-Aided Automated Detection of Railroad Trespassing. Transportation Research Record: Journal of the Transportation Research Board. https://doi.org/10.1177%2F0361198119846468

Cronin, B., Anderson, L., Fien-Helfman, D., Cronin, C., Cook, A., Lodato, M., & Venner, M. (2012). Attracting, Recruiting, and Retaining Skilled Staff for Transportation System Operations and Management. National Cooperative Research Program (No. Project 20-86). http://nap.edu/14603

Pustokhina, I., Putsokhin, D., Vaiyapuri, T., Gupta, D., Kumar, S., and Shankar, K. (2021). An Automated Deep Learning Based Anomaly Detection in Pedestrian Walkways for Vulnerable Road Users Safety. Safety Science. https://doi.org/10.1016/j.ssci.2021.105356

Szymkowski, T,. Ivey, S., Lopez, A., Noyes, P., Kehoe, N., Redden, C. (2019). Transportation Systems Management and Operations (TSMO) Workforce Guidebook: Final Guidebook. https://transportationops.org/tools/tsmo-workforce-guidebook.

Shi, Hang and Liu, Chengjun. (2020). A New Cast Shadow Detection Method for Traffic Surveillance Video Analysis Using Color and Statistical Modeling. Image and Vision Computing. https://doi.org/10.1016/j.imavis.2019.103863

Upper Great Plains Transportation Institute. (2021). Intelligent Safety Assessment of Rural Roadways Using Automated Image and Video Analysis (Active). University of Utah. https://www.mountain-plains.org/research/details.php?id=566

Zhang, Z., Liu, X., and Zaman, A. (2018). Video Analytics for Railroad Safety Research: An Artificial Intelligence Approach. Transportation Research Record: Journal of the Transportation Research Board. https://doi.org/10.1177%2F0361198118792751

Zhang, T. Guo, M., and Jin, P. (2020). Longitudinal-Scanline-Based Arterial Traffic Video Analytics with Coordinate Transformation Assisted by 3D Infrastructure Data. Transportation Research Record: Journal of the Transportation Research Board. https://doi.org/10.1177%2F0361198120971257

23rd Annual NJDOT Research Showcase

The 23rd Annual NJDOT Research Showcase was an opportunity for the New Jersey transportation community to learn about the broad scope of academic research initiatives underway and share technology transfer activities being conducted by institutions of higher education partners and their associates.  The annual event serves as a showcase to present the ongoing initiatives and benefits of the NJDOT Research program. This event was the second Research Showcase conducted by webinar with sessions held from 9:00am-2:45pm on October 27, 2021.

The Research Showcase Program included presentations by university researchers, NJ agency representatives, and engineers offering their perspectives and fielding questions on topics including electrification of vehicles, smart transportation and energy use. These presentations were followed by poster sessions presenting research of students attending New Jersey’s universities and colleges.


MORNING

Andrew Swords, Director, Division of Statewide Planning, New Jersey Department of Transportation welcomed attendees to the event.

The NJDOT Commissioner of Transportation, Diane Gutierrez-Scaccetti, provided opening remarks focusing on the need to work collectively to address climate change. Ms. Gutierrez-Scaccetti noted that partnerships among public, private, and academic organizations are essential to reach the state goal of an 80 percent reduction in greenhouse gas emissions by 2050. She touched on several recent NJDOT initiatives and adoption of technological innovations that support this goal and the agency’s mission to provide a safe, cost-effective transportation network for the traveling public.  In his opening remarks, Robert Clark, Federal Highway Administration's New Jersey Division Administrator, emphasized the need for research and innovation and noted federal funding awarded to, and agency support for, recent NJDOT initiatives.

Jane Cohen, Executive Director, New Jersey Governor’s Office of Climate Action and the Green Economy gave the keynote address on "Confronting Climate Change through Transportation Initiatives." Ms. Cohen discussed the need to reduce greenhouse gas emissions and explained how temperature increases from climate change can intensify air pollution as well as respiratory and cardiovascular health concerns that are disproportionately borne by overburdened communities. Ms. Cohen emphasized that environmental justice and equity are at the center of the work being done to chart a path forward to a clean energy future.  She highlighted recent landmark NJ state legislation (S-232 - Cumulative Impacts Law) and NJDEP's enforcement responsibilities to protect overburdened communities in permit review processes.

Noting that transportation makes up a larger percentage of greenhouse gas emissions, she stressed the need for coordination among state agencies to shift light duty, medium and heavy duty trucks, transit vehicles, and the state fleet to electric vehicles. NJ’s Partnership to Plug-In is a statewide initiative involving state agencies and private sector partners to build out the infrastructure needed to support electric vehicle ownership.  Ms. Cohen mentioned various funding sources for projects, including the regional cap and trade system as part of the Regional Greenhouse Gas Initiative, from the Volkswagen Mitigation Trust Fund, the NJ Zero Emission Incentive Program for the purchase of EVs, and an e-mobility program in Trenton through ISLES.  She highlighted several other essential transportation initiatives that are aligned with climate planning. including the adoption of Complete Streets policies, Transit Villages, and efforts to reduce Vehicle Miles Traveled (VMT). She promoted the value of integrating green infrastructure such as wetlands and rain gardens in transportation for greater resilience to stormwater and flooding.

In her closing remarks, she made an appeal to those in attendance to recognize the urgency of the moment and reflect on how they might contribute innovative solutions and how they might partner to work collectively toward addressing the challenges of climate change.  She recognized the Build the Better Mousetrap Competition as an example of adopting an orientation favorable to innovation. She stressed that her office welcomes new ideas such as pilot projects and programs and partnerships.

A panel of presenters from representing state agencies, academia, and industry followed:

  • Peg Hanna, Assistant Director, Air Monitoring and Mobile Sources, New Jersey Department of Environmental Protection, spoke about the need to use various approaches to reach goals, such as the Electric Shared Mobility Program grants and the DEP-funded ISLES program in Trenton, and the value of working with local residents to understand transportation needs and gaps, working with the private sector, and considering the sustainability of any program.
  • Andrew Tunnard, Assistant Commissioner, Transportation Operations Systems and Support, New Jersey Department of Transportation, introduced a study, New Jersey Fleet Electrification: Statewide Charging Facilities Design Recommendations, undertaken to determine locations for the state build-out of EV infrastructure and to create a framework for state agencies to move toward their goals of fleet transition.
  • Alain Kornhauser, PhD, Professor of Operations Research & Financial Engineering, Princeton University, discussed details of the study, including the cost/benefit analysis comparing EV charging infrastructure favorably to internal combustion fueling locations, and the equitable distribution of the burden for creating EV infrastructure among state agencies.
  • Spencer Reeder, Director of Government Affairs and Sustainability, Audi of America, spoke about the emerging market for electric vehicles and the expansion of options for buyers.
  • Julia Rege, Vice President for Energy and Environment, Alliance for Automotive Innovation, spoke about the need for purchase incentives for electric vehicles, for more infrastructure including more charging capacity, and to switch manufacturing and supply that is still geared to the internal combustion fleet.

Presenters responded to attendee questions. The audience was informed that research ideas can be submitted to the Transportation Research Ideas Portal through the NJDOT Technology Transfer website.

Plenary Session Recording

Keynote Address: Confronting Climate Change Through Transportation Initiative

Panel Presentation: Innovation in Transportation Electrification: Getting to 2050

Panel Presentation: New Jersey Fleet Electrification

The program continued as Amanda Gendek, Manager, NJDOT Bureau of Research, announced several awards given in recognition of research, innovation and implementation efforts.  Below is a listing of the award winners presented at this year's showcase:

  • 2021 Outstanding University Student in Transportation Research Award – Wei Huang, Rutgers University (Implementation of Porous Concrete for Sidewalks in New Jersey)
  • 2021 Best Poster Award – Xiao Chen, Rutgers University (Hot in-Place Recycling of Asphalt Pavement: Current Practice and New Technology)
  • 2021 NJDOT Research Implementation Award – Husam Najm, Hao Wang, Rutgers University (Implementation of Pervious (Porous) Concrete for Sidewalks)
  • 2021 NJDOT Build a Better Mousetrap Award (State Agency) – Marc Franco, NJ TRANSIT, Tire Centerline Bracket
  • 2021 NJDOT Build a Better Mousetrap Award (Local Agency) – Art Villano, Montgomery Township, Inlet Repair Trailer

The Build a Better a Mousetrap Award for an entry from a state agency was given to Marc Franco from NJ TRANSIT. His Tire Centerline bracket provides a simple means for finding the centerline of the tire when installing the air-operated snow chain systems on the fleet of buses. The process, critical to the proper operation of these systems, increases safety and efficiency, and reduces costs.

The Build a Better a Mousetrap Award for an entry from a local agency was given to Art Villano from Montgomery Township who found a more efficient means to transport all needed equipment and materials to work sites to conduct inlet repairs. The use of a low deck trailer and the availability of an electric crane increased safety for workers.  


AFTERNOON

In the afternoon, concurrent break-out sessions for research presentations focused on the topics of Energy/Electrification, Infrastructure, and Smart Transportation, and for the presentation of posters from students and researchers at New Jersey’s colleges and universities describing their methods and findings on ongoing and recently completed research and responding to questions by attendees.

Energy/Electrification Session Recording

Smart Transportation Session Recording

Infrastructure Session Recording

Poster Session Recording


Energy/Electrification Presentations

Laura Soares, Rutgers University, Energy Harvesting Evaluation of Photovoltaic Noise Barriers on Highways  LINK

Chris Lamm, Cambridge Systematics, Al Beatty, CALSTART, and Leslie Fordjour, New York Multi-State Regional Clean Freight Corridors Study  LINK


Infrastructure Presentations

Xiao Tan, Stevens Institute of Technology, Achieving Resilient and Smart Concrete Bridges by Mapping Strains and Cracks Using Distributed Fiber Optic Sensors LINK

Sougata Roy, Rutgers University, Innovative Metal Deck for Efficient Infrastructure  LINK

Kaan Ozbay and Jingqin Gao, New York University, Bridge Management System with Life Cycle Cost Optimization as a Decision Support Tool: A Case Study in New Jersey  LINK


Smart Transportation Presentations

Mohammad Jalayer, Rowan University, A Novel Approach to Identify Distracted Drivers in New Jersey LINK

Anjiang Chen, Rutgers University, Integrated Pandemic Travel Demand and Epidemiology Modeling for COVID-19 Case Prediction and Impact on Regional Travel Behavior in 2020  LINK

Abdullah Shabarek, New Jersey Institute of Technology, Predicting Traffic Speed for New Jersey Freeway Work Zones - A Deep Learning Approach  LINK


Poster Presentations

Hot In-Place Recycling of Asphalt Pavement: Current Practice and New Technology - Xiao Chen, Rutgers University

An Innovative Green Pervious Concrete Made with Modified Geopolymer Materials - Wei Huang, Rutgers University

Modelling and Mitigating of Thermal-Induced Reflective Cracking in Asphalt Concrete Overlay - Pengyu Xie, Rutgers University

Understanding the Interconnectivity between Intersection Traffic Congestion, and Outdoor Air Quality for Smart Cities - Kourtney Arena, Rowan University

Estimating Roadway Horizontal Alignment Information Using Machine Learning - Bekir Bartin, New York University

Influence of Cracking and Brine Concentration on Corrosion and Chloride Content - Aaron Strand, New Jersey Institute of Technology

Supporting Bridge Deck Condition Assessment Through the Use of TLS - Issa Al-Shaini, Rowan University

New Brunswick Innovation Hub Smart Mobility Testing Ground, Data City: A Smart and Autonomous Initiative - Peter J. Jin, Rutgers University


The 23rd Annual NJDOT Research Showcase was organized and sponsored by the NJDOT Bureau of Research in partnership with the New Jersey Local Technical Assistance Program (NJLTAP) at Rutgers Center for Advanced Infrastructure and Transportation (CAIT) and co-sponsored by the Federal Highway Administration.


NJDOT’s “Weather Savvy Roads” System Receives 2021 Outstanding Project Award from ITS-NJ

The Intelligent Transportation Society of New Jersey (ITS-NJ) recognizes outstanding projects or programs that employ or advance ITS technologies. This year NJDOT’s “Weather Savvy Roads” system, also known as the Mobile RWIS effort, received its 2021 Outstanding Project Award.

NJDOT’s Weather Savvy Roads Program was recently recognized by the Intelligent Transportation Society of New Jersey

NJDOT’s Weather Savvy Roads (WSR) program started with NJDOT’s Mobility Division applying for and receiving NJ’s first federal Accelerated Innovation Deployment (AID) grant.  The concept was to procure and install mobile RWIS devices and dash cameras in 23 DOT snow-fighting vehicles statewide to view real time conditions and guide decisions for allocation of resources during a winter event.

The team is comprised of staff from NJDOT Mobility, NJDOT Operations, the NJIT ITS Resource Center, and technical partners from Vaisala and EAI.  NJIT created a web-based platform where users could view a statewide map and data from the RWIS devices and video from the CCTV6 in real time.

The WSR project was also designed to continue NJDOT’s investigation into cellular strength along NJDOT’s road network. This effort was first evaluated during NJ STIC Incentive grant funded program using iCone devices on SSP trucks. Utilizing a cellular router carrying FIRSTNET cellular capability, the technical team at NJIT is evaluating the strength of this first responder-only focused cellular system to see the various levels of signal strength. The project has shown tremendous benefits after just one winter season with staff across multiple levels of the Department utilizing the web platform to make better informed decisions about staffing and contractor use.

To learn more about the project, click on the NJ Innovative Initiatives, Weather Responsive Management Strategies page, or watch a presentation to the NJ STIC by Sal Cowan, Senior Director of Mobility at NJDOT about the equipment installation and web interface efforts taken for the pilot project.

See the FHWA’s Innovation Spotlight video on Road Weather Management: Weather Savvy Roads.

Rising to the Challenge Part II: How State DOTs Are Building Resiliency

Figure 1. The Hanging Lake Tunnels on I-70 in Colorado were targeted in the state DOT’s resiliency planning. ThreadedThoughts | Flickr

The previous article in this two-part series addressed the ways that state DOTs have been innovating to reduce Greenhouse gas (GHG) emissions, as a means of slowing climate change. However, an already changing climate is bringing more severe and unprecedented weather, challenging the durability of the nation’s infrastructure.

Resiliency is defined by the State of New Jersey as “as the ability of social and ecological systems to absorb and adapt to shocks and stresses resulting from a changing climate, while becoming better positioned to respond in the future.” Many state DOTS are rising to this challenge, innovating through adoption of planning, technological, and engineering methods to protect roads, bridges and the people that use them.

In Colorado, an example of climate change-exacerbated weather affecting a vital interstate link illustrates both the growing threat and the potential for action. Between the municipalities of Dotsero and Glenwood Springs, Interstate 70 travels through the Rocky Mountains (Fig. 1), following a narrow canyon bed alongside the Colorado River. In early fall 2020, the Grizzly Creek Fire burned through 32,631 acres, including the elevated terrain above I-70. Then, in summer 2021, an atypically high rainfall event created a large mudslide that poured onto the highway, bringing traffic to a halt and trapping some motorists in the nearby Hanging Lake Tunnels. But, had thorough resiliency planning not been conducted after a devastating 2013 rockslide in the same vicinity, further destruction would have been assured. Instead, a berm built in 2020 diverted 100,000 cubic yards of debris away from the tunnels (and a Colorado Department of Transportation (CDOT) Command Center), saving lives and hundreds of millions of dollars in the process. According to CDOT’s director of maintenance and operations, the berm improvement cost less than $50,000.

Figure 2: A map of large-scale weather and climate disasters in the first half of 2021. Such occurrences have been increasing in frequency since the 1980s. Courtesy of National Oceanographic and Atmosphere Administration.
Figure 2. A map of large-scale weather and climate disasters in the first half of 2021. Such occurrences have been increasing in frequency since the 1980s. Courtesy of NOAA

This dramatic case study demonstrates the value of risk and resilience planning for a state roadway network. But Colorado, of course, is not on its own. According to the National Oceanic and Atmospheric Administration (NOAA), billion-dollar climate-borne disasters have been steadily increasing since the agency began tracking them in 1980 (Fig. 2). In particular, our transportation infrastructure, vital for so many economic and societal functions, is challenged by increasingly frequent and severe weather events. While different geographies present different threats, there is a common need for threat assessment and decision-making frameworks to strategically build infrastructure resilience. There is much opportunity to innovate with new technologies, engineering methods, and planning frameworks for the purpose of strengthening our transportation network.


Table 1. A Brief Scan of Resiliency Planning Initiatives

StateThemeAction
CaliforniaAssessment - ComprehensiveFive-tier adaptation report for each district
CaliforniaAssessment - Sea Level RisePilot sea-level rise assessment in San Francisco Bay Area
ColoradoAssessment - ComprehensiveRisk and Resilience Analysis Procedure
FHWAAssessment - ComprehensiveVulnerability Assessment and Adaptation Framework, 3rd Edition
FloridaAssessment - Sea Level RiseSea Level Scenario Sketch Planning Tool
HawaiiAssessment - ComprehensiveAction plan that identifies risky areas and strategies for incorporating resilience
IllinoisAssessment - ComprehensiveRisk analysis, now developing processes to implement resilience
IowaAssessment - FloodingResiliency and vulnerability assessment for I-380
New JerseyAssessment - FloodingFlood Risk Mapping Project
TexasAssessment - ComprehensiveClimate Change/Extreme Weather Vulnerability and Risk Assessment for
Transportation Infrastructure in Dallas and Tarrant Counties
VermontAssessment - FloodingTool for identifying risk levels for roads, bridges and culverts
WashingtonAssessment - ComprehensiveStatewide climate analysis of vulnerable agency-owned infrastructure
WashingtonAssessment - FloodingSkagit County targeted assessment of flood risk

FHWA & NCHRP Research Frameworks

In 2012, the Moving Ahead for Progress in the 21st Century Act (MAP-21) called for each state to create “a risk-based asset management plan for the National Highway System to improve or preserve the condition of the assets and the performance of the system” (MAP-21, 2012). The FHWA resource, Vulnerability Assessment and Adaptation Framework, 3rd Edition (2017), seeks to combine the legislatively-mandated work of risk assessment with the rising threat of climate change upon the system.

The Framework shares examples of approaches for each step in the vulnerability assessment and adaptation framework (see Fig. 3). For example, for the first step, “Articulate objectives and define study scope,” the report gives instances of the North Central Texas Council of Governments’ vulnerability assessment work, the San Francisco Bay Area’s Metropolitan Transportation Commission’s (MTC) ongoing efforts to model and react to sea level rise and storm surge, as well as the Iowa Department of Transportation’s and Massachusetts Department of Transportation’s respective inquiries into how increased flooding would affect critical infrastructure. For state DOTs looking for a rich bibliography of vulnerability assessment resources and case studies, the FHWA Framework’s Appendix A includes resources for selecting climate variables, projecting temperature and precipitation, obtaining sea level rise information, and determining how to incorporate results of assessments into the transportation planning process, among others.

Figure 3. FHWA’s Vulnerability Assessment and Adaptation Framework is a primer for DOTs looking to integrate a changing climate with their risk assessments. Courtesy of FHWA.
Figure 3. FHWA’s Vulnerability Assessment and Adaptation Framework is a primer for DOTs looking to integrate a changing climate with their risk assessments. Courtesy of FHWA

The National Highway Cooperative Research Program (NCHRP), an initiative supported by the American Association of State Highway and Transportation Officials (AASHTO), working in cooperation with FHWA, has been researching resilience planning for state DOTs, with several ongoing projects. A brief scan of recent work finds a variety of other resiliency initiatives undertaken by state DOTs in roadway engineering, planning, and operations, with several reports reiterating that there remains work to be done.

The program’s 2019 Applying Climate Change Information to Hydrologic and Coastal Design of Transportation Infrastructure addresses how to plan and engineer hydrologic and coastal infrastructure for a changing climate. Typically, engineers use historical assumptions to predict future conditions, but, in a changing climate, this approach is problematic. The guide provides two different decision-making frameworks, Top-Down and Threshold (Bottom-Up), as well as probabilistic risk assessments to best understand the appropriate course of action, such as whether to significantly invest in making a facility more resilient.

A report published by NCHRP the previous year, Resilience in Transportation, Planning, Engineering, Management, Policy, and Administration (2018), works to synthesize the state of the practice. The survey of 40 state DOTs revealed a pressing need for resilience metrics and assessment methods. According to the study, “Currently there is no standard measurement for resilience within highway analysis.” However, in the intervening years, many state DOTs have begun the work of developing risk assessments and resiliency plans.

NCHRP’s Incorporating the Costs and Benefits of Adaptation Measures in Preparation for Extreme Weather Events and Climate Change Guidebook (2020) describes technical steps to assist agencies in conducting CBAs (Cost-Benefit Analyses) for climate resilience. With sample scenarios and problems, the resource explains the necessity for CBAs as a resilience decision-making tool, and the various considerations that must be taken into account. Later, this article will touch upon how CDOT used CBAs for its risk assessments and resiliency planning.

Finally, NCHRP’s Transportation System Resilience: Research Roadmap and White Papers (2021) identifies several pressing research needs for the current five-year period. After synthesizing reports, and conducting workshops and outreach, consultants created a ranked list of projects; notably, the first two of these projects were Integrating Resilience into Transportation Project Development and Economic Benefits from Making Investments in Resilient Transportation Assets. The report calls for continued, balanced research into many topics to build the most system resilience, cautioning that: “Disruptive forces have no end point but continue and may, in fact, worsen over time. Recovery is not an option – the best that can be hoped for is continuous adaptation.”

Analyzing and Prioritizing Vulnerable Assets

Figure 4: The Golden Gate Bridge was one of the Priority 1 assets targeted in Caltrans’ resiliency assessment. FrankBrueck | Wikimedia Commons
Figure 4. The Golden Gate Bridge was one of the Priority 1 assets targeted in Caltrans’ resiliency assessment. FrankBrueck | Wikimedia Commons

A handful of geographically diverse state DOTs provide insightful examples of the present state of resiliency planning. Due to federal requirements, DOTs have conducted in-depth inventories of state roadway networks, categorizing them by vulnerability and level of risk. The handful of examples that follow show how different jurisdictions and geographies have approached this work to understand how environmental shifts are anticipated to affect infrastructure, and to prioritize facilities by their significance to the overall transportation network.

In California, Caltrans has compiled adaptation priority reports for each district. For District 4, which encompasses the Bay Area region, Caltrans and consultants assigned an Average Cross-Hazard Prioritization Score to each exposed bridge, culvert, and roadway asset. A score for each asset was calculated using context-sensitive criteria—for instance, temperature affects the integrity of asphalt binders more significantly than it would a culvert. On the Priority 1 Tier are major, threatened pieces of infrastructure, such as the Golden Gate Bridge, a large culvert over the Transmission Canal, and many segments of coastal roadway around the San Francisco Bay. According to the document, the next steps will be to prepare more detailed adaptation assessments for these assets, as well as to integrate these prioritization measures into the district’s asset management system.

Figure 5. A segment of VT-107 damaged by Tropical Storm Irene, which motivated the development of the Transportation Resilience Planning Tool (TRPT). Courtesy Vermont Agency of Transportation.
Figure 5. A segment of VT-107 damaged by Tropical Storm Irene, which motivated the development of the Transportation Resilience Planning Tool (TRPT). Courtesy of the Vermont Agency of Transportation

This work has been conducted in East Coast states as well. The Vermont Agency of Transportation (Vtrans) developed an in-house tool for identifying risk levels for roads, bridges, and culverts. The Transportation Resilience Planning Tool (TRPT) takes into account measures of Vulnerability, Criticality, Risk, and Mitigation for its four areas of analysis. Additionally, Vtrans has made the Tool available as a web-based application for ease of use. For example, an examination of the roadway network near East Dorset, Vermont, shows a stretch of the Ethan Allen Highway with a 9/10 Vulnerability score, and 7/10 Criticality score. Because this segment’s right-of-way overlaps with that of an adjacent river, it is particularly vulnerable to erosion. The Tool also contains suggested countermeasures, which in this case include strategies such as planting more vegetation, armoring the riverbank and road, and more costly measures, like adjusting the road’s alignment. Cost estimates for these actions are also given.

Nearby, in Maine, the state department of transportation (MaineDOT) recently completed and published a survey of undersized culverts in the state. The purpose of this work was to identify locations where flooding on the state roadway network might most likely occur, and, in a granular fashion, identify necessary improvements. On the interactive ArcGIS application, one randomly selected culvert on Interstate 395 in Bangor (Fig. 6), was listed as needing an additional one to ten feet expansion, while another, on a nearby clover leaf, needed none. State agencies in Illinois and Delaware have been compiling similar inventories to those in California and Vermont.

Figure 6. MaineDOT’s Cross Culvert’s GIS layer shows culverts slated for upgrades. Courtesy of MaineDOT

The purpose of such work, in the context of a changing climate, is to understand, on a granular level, the weaknesses and strengths of the state’s system, and then to develop a systematic plan of action. Hawaii, after doing so, found that 58 percent of the state’s highway network was vulnerable to climate-borne stresses. Hawaii’s plan then called for including these considerations in the department’s technical and process guidance, so that, infrastructure could be adapted to face assessed threats in the future.

Mapping Coastal Resilience

In New Jersey, work to expand the NJDOT Flood Risk Visualization Tool is underway. At the 2020 NJDOT Research Showcase, Jon Carnegie, Executive Director of the Alan M. Voorhees Transportation Center at Rutgers University, presented on work from a research team tasked with assisting NJDOT in assessing growing flood risk for the road network by developing the GIS-based Flood Risk Visualization Tool. The first phase of the tool was released in December, 2020, allowing NJDOT to use coastal data from NJFloodMapper and inland flooding data from FEMA to flag areas that may be adversely affected by climate change. The second phase will involve modeling flooding scenarios from specific storm events, thereby enabling NJDOT engineers and planners to effectively assess vulnerability and integrate it into the decision-making process. When finished, this internal tool will allow staff to “zoom-to” particular segments or mile-posts of the state highway network, and view the climate-borne challenges that a particular asset might face.

Figure 7. A mapping tool shows sea level rise (SLR) scenarios and affected transportation infrastructure in Miami Beach. Courtesy of University of Florida

For instance, in the event of a 1-ft sea-level rise (which Rutgers scientists predict is likely to occur by 2070), the current mapping application shows the devastating effects of a Category 2 hurricane on Atlantic City, dramatically worsening the storm’s flooding impacts. The Florida Department of Transportation (FDOT), in association with the University of Florida GeoPlan Center, have developed something similar, the Sea Level Scenario Sketch Planning Tool. This application specifically focuses on transportation infrastructure, showing, for example, a 2070 scenario in Miami Beach (Fig. 7) that illustrates sea-level rise (SLR) affecting a majority of roads on the barrier island. The NJFloodMapper also models SLR, with projections for rising seas to begin consuming the Jersey Shore.

Resiliency at NJDOT

Here in New Jersey, NJDOT is currently engaged in an enterprise-wide effort to integrate resiliency into major functions. The department’s intention is to establish resilience as an adoptive policy for the agency, in a manner similar to that of Complete Streets.

Driven by goals set out in the 2021 State of New Jersey Climate Change Resiliency Strategy, NJDOT and agency partners are collaborating to integrate resiliency in a variety of ways. For example, NJDOT is working with the Department of Environmental Protection (NJDEP) to effectively predict shifting rainfall patterns’ effects on flooding, which will be used to update stormwater management guidance. Another initiative in the strategy calls for coordinated, cross-agency regional sediment management plans, for the purpose of properly re-using dredged material for resiliency improvements, such as elevating marshes or potentially creating new near-shore islands. To mitigate the complex threats of climate change, such multidisciplinary collaboration is required.

Figure 8. NJDOT is looking to integrate resilience into workflows department-wide, and developing new tools to support staff in their efforts. Hydropeek | Wikimedia Commons

At NJDOT, several technical tools are being developed to support these efforts. The Flood Risk Visualization Tool, mentioned above, is one example. Another is a Criticality Tool, which analyzes data on infrastructure assets, and will assist staff in discerning the most essential pieces of the transportation system. The Climate Hazard Visualization Tool will help staff to “red flag” potential points of exposure, particularly regarding storm surge and flooding.

With these tools in place, resiliency will be integrated into workflows, for instance, becoming a component under consideration in the concept development process, impacting the outcome of preliminary engineering or design work.

Assessment-Informed Decisionmaking

The Pennsylvania Climate Action Plan, in its climate adaptation section for built infrastructure, makes the financial case for resilience investments: “for every $1 invested by the public sector in disaster mitigations, $6 is saved in recovery costs.” This figure, culled from a cost-benefit analysis from the National Institute of Building Sciences, makes a powerful argument for making necessary but expensive resilience investments.

Figure 9. The seven-step Risk and Resilience Analysis Procedure from CDOT guides risk calculation and resilience prioritization. Courtesy of CDOT.
Figure 9. The seven-step Risk and Resilience Analysis Procedure from CDOT guides risk calculation and resilience prioritization. Courtesy of CDOT

CDOT’s Risk and Resilience Analysis Procedure (2020) stands out for the economic considerations and educational tools that the manual provides to build the capabilities of agency staff to conduct analyses and calculate costs. With sample problems, the resource walks through how to conduct such an assessment, including components such as user consequence (such as lost time or damage), and owner risk (such as cleanup and restoration costs), which are summed and presented as an annual figure, in dollars.

Consultants created a criticality score (including elements such as traffic, freight value, tourism, etc.), to gauge a particular state highway network asset’s importance to the overall vitality of the state’s economy. In the agency’s example, a Level of Resilience (LOR) index was created for 1-mile roadway segments across the I-70 Corridor. The Index takes into account each segment’s criticality for systems operations, as well as cumulative annual risk, and assigns each a letter grade. After sections of a corridor are graded according to the LOR Index, certain segments can be strategically targeted. In these areas, an economic analysis, to study the efficacy of making resilience improvements, is to be performed. The Risk and Resilience Procedure provides sample cases of such analyses.

Figure 10. CDOT’s Level of Resilience (LOR) Index for the I-70 Corridor, identifying critical, vulnerable segments to be studied. Courtesy of CDOT

For example, risk management for a minor culvert is performed as follows: total annual risk, which would continue without a mitigation, is calculated as $260,424. For the next step, a proposed mitigation, in this case replacing the existing culvert with a 72-inch RCP pipe, is said to cost $500,000. Now, a risk assessment is calculated as if the new pipe were in place—total annual risk drops to $51,114. On the fourth and final step, the economic analysis is performed, to see if this intervention is worthwhile. First, the mitigation benefit is calculated as the total annual risk from the mitigation ($51,114) subtracted from the baseline total annual risk ($260,424), leading to a positive mitigation benefit of $209,310. Then, the ultimate Benefit-Cost (BC) ratio is assigned. In this case, the $500,000 pipe mitigation is given a $17,168 annual cost, which serves as the denominator in the ultimate calculation: Annual mitigation benefit divided by annual mitigation cost (B/C), or $209,310 divided by $17,168. Here, B/C = 12.2, well over the value of 1 needed to prove that the mitigation is economically viable. Thus, the new pipe in the culvert will be a worthwhile investment.

Figure 11. A sample framework for performing Economic Analysis for Risk Management, from CDOT’s Risk and Resilience Analysis Procedure. Courtesy of CDOT

Using the formulas and steps laid out in the resource, CDOT staff may calculate the risk of flooding in a major culvert, or a post-fire debris flow in a tunnel, such as what occurred in Glenwood Canyon on I-70 in July 2021. With this framework in place, the agency is able to make informed decisions about how to prioritize resiliency investments, and strategically mitigate future disasters.

In Washington State, a 2015 FHWA-sponsored pilot study looked to transition from risk assessment to developing a scenario-planning and decision-making framework. Creating a Resilient Transportation Network in Skagit County: Using Flood Studies to Inform Transportation Asset Management examines adaptation options for state transportation facilities in the vulnerable Skagit River Basin. The pilot combines information from WSDOT’s previous comprehensive risk assessment with the results of a flood study from the U.S. Army Corps of Engineers. However, had the planners been unaware of a plan to improve and extend levees in the region, their suggested alternatives would have been misinformed, leading to what is termed maladaptation. “There is a synergy that comes from combining our efforts.” the report concludes. “When we work together, we can find solutions that might not be possible, and avoid problems that might occur.”

Conclusion

The methods outlined in this article, while by no means encompassing the scope of resiliency efforts underway at state DOTs in the Unites States, provide a glimpse into how some transportation agencies are approaching the threat of climate change. Broadly speaking, there is a need to comprehensively inventory infrastructure, grading it based on levels of criticality and vulnerability, and then to develop a phased plan detailing how resiliency measures will be taken.

Because there are many DOTs considering this issue, it is beneficial to examine their various approaches, especially in states with weather and infrastructure networks similar to New Jersey’s. While Colorado, with its mountains, wildfires, and mudslides, varies wildly with the East Coast, CDOT can be seen as a leading model for the process of climate resiliency planning. The preponderance of threats motivated the agency to develop a response plan early on, which now provides a toolkit and road map for its statewide resiliency work. The threat of climate change is great, but it brings with it an opportunity to innovate, to develop new processes and technologies that make a stronger, safer network for the traveling public.


Bibliography

Caltrans. (2020, December). Adaptation Priorities Report: District 4. Caltrans. https://dot.ca.gov/-/media/dot-media/programs/transportation-planning/documents/2020-adaption-priorities-reports/d4-adaptation-priorities-report-2020-v2-a11y.pdf

Colorado Department of Transportation. CDOT Resilience Program. Colorado Department of Transportation. https://www.codot.gov/programs/planning/cdot-resilience-program

Colorado Department of Transportation. (2020). Risk and Resilience Analysis Procedure. Colorado Department of Transportation. https://www.codot.gov/programs/planning/cdot-rnr-analysis-procedure-8-4-2020-v6.pdf

Commonwealth of Pennsylvania. (2021). Pennsylvania Climate Action Plan. Commonwealth of Pennsylvania. https://www.dep.pa.gov/citizens/climate/Pages/PA-Climate-Action-Plan.aspx

Delaware Department of Transportation. (2017, July). Strategic Implementation Plan for Climate Change, Sustainability & Resilience for Transportation. Delaware Department of Transportation. https://deldot.gov/Publications/reports/SIP/pdfs/SIP_FINAL_2017-07-28.pdf

Federal Highway Administration. (2017, December). Vulnerability Assessment and Adaptation Framework, Third Edition. Federal Highway Administration. https://www.fhwa.dot.gov/environment/sustainability/resilience/adaptation_framework/climate_adaptation.pdf

Florida Department of Transportation. Resiliency Subject Brief. Florida Department of Transportation. https://fdotwww.blob.core.windows.net/sitefinity/docs/default-source/planning/policy/briefing_sheets_resilience_0630.pdf?sfvrsn=1173ebf_2

Hawaii Department of Transportation. (2021, May). Hawaii Highways Climate Adaptation Action Plan: Strategies for a More Resilient Future. Hawaii Department of Transportation. https://hidot.hawaii.gov/wp-content/uploads/2021/07/HDOT-Climate-Resilience-Action-Plan-and-Appendices-May-2021.pdf

Illinois Department of Transportation. Long-Range Transportation Plan. Illinois Department of Transportation. https://idot.illinois.gov/Assets/uploads/files/About-IDOT/Misc/Planning/IDOT_LRTP_5_Resiliency_Final.pdf

Iowa Department of Transportation. (2018, February). Interstate 380 Planning Study (PEL): Evaluation of I-380 Resiliency and Vulnerability. Iowa Department of Transportation. https://iowadot.gov/i380planningstudy/pdfs/I380_TechMemo_ResiliencyReport.pdf

Massachusetts Department of Transportation. (2015, June). MassDOT-FHWA Pilot Project Report: Climate and Extreme Weather Vulnerability Assessments And Adaptation Options for the Central Artery. Massachusetts Department of Transportation. https://www.mass.gov/files/documents/2018/08/09/MassDOT_FHWA_Climate_Change_Vulnerability_1.pdf

Metropolitan Transportation Commission. (2011). Adapting to Rising Tides: Transportation Vulnerability and Risk Assessment Pilot Project. Metropolitan Transportation Commission. http://www.adaptingtorisingtides.org/wp-content/uploads/2015/04/RisingTides_TechnicalReport_sm.pdf

National Cooperative Highway Research Program. (2019, March 15). Applying Climate Change Information to Hydrologic and Coastal Design of Transportation Infrastructure. Transportation Research Board. http://onlinepubs.trb.org/onlinepubs/nchrp/docs/NCHRP1561DesignPracticesGuide.pdf

National Cooperative Highway Research Program. (2020). Incorporating the Costs and Benefits of Adaptation Measures in Preparation for Extreme Weather Events and Climate Change Guidebook. Transportation Research Board. http://nap.edu/25744

National Cooperative Highway Research Program. (2018). Resilience in Transportation, Planning, Engineering, Management, Policy, and Administration. Transportation Research Board. http://nap.edu/25166

National Cooperative Highway Research Program. (2021). Transportation System Resilience: Research Roadmap and White Papers. Transportation Research Board. http://nap.edu/26160

New York State Department of Transportation. BRIDGE NY. New York State Department of Transportation. https://www.dot.ny.gov/BRIDGENY

State of New Jersey (2021). State of New Jersey Climate Change Resiliency Strategy. State of New Jersey. https://www.nj.gov/dep/climatechange/resilience-strategy.html

Transportation Research Board. (2020, September), Transportation Research Circular: Transportation Resilience 2019: 2nd International Conference on Resilience to Natural Hazards and Extreme Weather Events. Transportation Research Board. http://onlinepubs.trb.org/onlinepubs/circulars/ec265.pdf

Turnbull, Katherine. (2016). Transportation Resilience: Adaptation to Climate Change. National Academies of Sciences, Engineering, and Medicine. http://nap.edu/24648

University of Texas at Arlington. (2013). Climate Change/Extreme Weather Vulnerability and Risk Assessment for Transportation Infrastructure in Dallas and Tarrant Counties. North Central Texas Council of Governments. https://cpb-us-e1.wpmucdn.com/blog.uta.edu/dist/3/4734/files/2018/06/NCTCOG_FHWAClimateChangePilot_RevisedFinal_3-24-15-1piorzb.pdf

Vermont Agency of Transportation. (2019, January 31). User Guide for the Vermont Transportation Resilience Planning Tool. Vermont Agency of Transportation. https://vtrans.vermont.gov/sites/aot/files/planning/documents/planning/TRPT%20User%20Guide%201.0.pdf

Washington State Department of Transportation. (2011, November). Climate Impacts Vulnerability Assessment. Washington State Department of Transportation. https://wsdot.wa.gov/sites/default/files/2011/07/28/Climate-Impact-AssessmentforFHWA-12-2011.pdf

Washington State Department of Transportation. (2015). Creating a Resilient Transportation Network in Skagit County: Using Flood Studies to Inform Transportation Asset Management. Washington State Department of Transportation. https://wsdot.wa.gov/publications/fulltext/design/Skagit_County_Report_Appendices.pdf

Yang, David Y., and Frangopol, Dan M. (2019, November). Physics-Based Assessment of Climate Change Impact on Long-Term Regional Bridge Scour Risk Using Hydrologic Modeling: Application to Lehigh River Watershed. Journal of Bridge Engineering. https://ascelibrary.org/doi/10.1061/%28ASCE%29BE.1943-5592.0001462

EDC-6 Progress Report #1

The Every Day Counts Round 6 Progress Report is now available.

Every Day Counts: Innovation for a Nation on the Move

Every Day Counts (EDC) is the Federal Highway Administration’s (FHWA’s) program to advance a culture of innovation in the transportation community in partnership with public and private stakeholders. Through this State-based effort, FHWA coordinates rapid deployment of proven strategies and technologies to shorten the project delivery process, enhance roadway safety, reduce traffic congestion, and integrate automation.

This report summarizes the June 2021 status of deployment for the seven innovations in the sixth round of EDC. The report is intended to be a resource for transportation stakeholders as they develop their deployment plans and to encourage innovation in managing highway project delivery to better serve the Nation.