Targeted Overlay Payment Solutions (TOPS): NJDOT Example Featured

This article first appeared in the FHWA’s EDC News Weekly Newsletter of August 26th, 2021 and featured NJDOT’s application of high performance thin overlays (HPTO) as a pavement preservation tool.

Targeted Overlay Pavement Solutions

Last week, we discussed a case study involving bonded concrete overlays, part of the Targeted Overlay Pavement Solutions (TOPS) toolbox. This week, we’ll look at how New Jersey has used high performance thin overlays (HPTO) successfully as a pavement preservation tool.

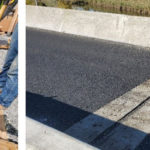
Since 2015, NJDOT has used HPTO on more than 1,000 lane miles to seal pavement and improve ride quality. Benefits include short road closures reducing impact on traffic, and addition of approximately 10 years of service life. Timing of the application is crucial. A Rutgers University study found applying HPTO to pavements while they are still in “good” condition more than doubles the service life compared to applying the product to pavements in “fair” condition.

Contractors who construct NJDOT projects have not reported constructability issues or complaints about the mix. NJDOT believes including performance requirements for the mixture, understanding treatment selection and application timing, and requiring project engineers to approve specifications are key factors in the success of HPTO as a pavement preservation tool.

Based on this research and evaluation of projects to date, NJDOT considers HPTO a cost-effective solution that provides a safe, smooth, crack and rut resistant surface that extends the life of the pavement and causes minimal impact on the road users and environment during construction.

Research Spotlight: Evaluating the Pedestrian Hybrid Beacon’s Effectiveness:  A Case Study in New Jersey

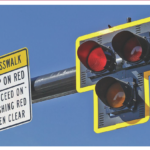
A Pedestrian Hybrid Beacon (PHB) is a signalized, pedestrian-activated device designed to increase crossing safety. A recent study conducted by the New Jersey Bicycle and Pedestrian Resource Center (BPRC), funded by NJDOT, examined the efficacy and public awareness of PHBs in New Jersey. The authors, researchers from Rowan and Rutgers universities, found a persistent need to better educate motorists and pedestrians in New Jersey on the PHB and its phases.

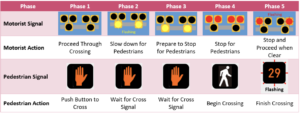
The five phases Pedestrian Hybrid Beacon’s (PHB) operations

The five phases Pedestrian Hybrid Beacon’s (PHB) operations

Pedestrian Hybrid Beacons are one of FHWA’s seven Safe Transportation for Every Pedestrian (STEP) countermeasures, proven methods of reducing pedestrian collisions. STEP was promoted through multiple rounds of the FHWA’s Every Day Counts (EDC) Program. A PHB is typically placed to improve pedestrian safety at uncontrolled and mid-block crossings, in locations with high pedestrian demand and wide roadways. The treatment consists of two signal arms on each side, with pedestrian “push buttons” and a crosswalk. The PHB operates in five phases. In the first, the PHB’s signal is off. The second phase begins when a pedestrian activates it by pressing a button, prompting the signal to flash a yellow light. Then, for the third phase, the flashing transitions to a solid yellow light, communicating to drivers that they should prepare to stop. Then the light turns red, and, in the fourth phase, the pedestrian signal changes to “Walk.” After an interval, the fifth phase begins: the pedestrian signal displays a countdown timer, and the traffic signal flashes alternating red lights, telling drivers to stop and that they may proceed if the crosswalk is clear.

The study’s literature review found multiple examples of prior research demonstrating the efficacy of PHBs. In the case of Tucson, Arizona, where one of the first PHBs was deployed in the United States, one study found a 69 percent decrease in pedestrian-related crashes in the signal area. Another analysis in Tucson found a 97 percent yielding rate from drivers at PHB-equipped crossings. One of the chief findings from the literature review was that PHB signal evaluations were lacking in New Jersey. Thus, researchers aimed to more systematically analyze PHBs in the state.

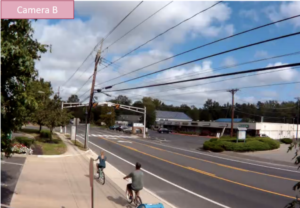
The authors found ten implemented examples of PHBs throughout the state, from Bergen County to Atlantic County. For more in-depth research, they selected signals in three different community types (urban, suburban, and campus area), in Morristown, Medford, and New Brunswick, New Jersey, to undergo video analysis.

The five phases Pedestrian Hybrid Beacon’s (PHB) operations

The five phases Pedestrian Hybrid Beacon’s (PHB) operations

One commonality observed in all three locations was an apparent confusion for motorists concerning the fifth phase, in which the signal flashes red, indicating that drivers should stop and then proceed with caution. In New Brunswick, 100 percent of observed motorists remained stopped, even after the intersection had been cleared. In Morristown, the vast majority of pedestrians (91.3%) failed to use the PHB during the morning period, and also failed to do so in the evening (83%). The authors attribute such behavior to the PHB timing being linked to two nearby traffic signals, contributing to extra delay after the crossing button has been pressed. When inconvenient, it seems, pedestrians may opt to cross on their own.

To better understand the familiarity of pedestrians and motorists in New Jersey with PHBs, the researchers designed an online survey that was sent to 79,567 randomly selected email addresses from 30 communities across the state. While respondents indicated some confusion as to how PHBs functioned, a plurality indicated that they would be very likely or somewhat likely to support  implementation in their own community. A majority of respondents (85.9%) reported that they had never heard of PHBs, and later indicated that completing the short survey had increased their knowledge of the safety treatment, showing the potential benefit of more public education about their functionality.

The report concludes by stating that while PHBs are proven to be effective at increasing pedestrian crossing safety, a lack of public awareness on the part of both drivers and pedestrians currently limits the effectiveness of these devices. The researchers suggest updating the New Jersey Motor Vehicle Commission’s Driver’s Handbook to include the PHB, and to differentiate the flashing red signals at a PHB where the driver must yield and then proceed if the crosswalk is clear, from the flashing red signals at railroad crossings where the driver is required to stop and remain stopped. This addition could be complemented with a public education campaign to teach pedestrians and drivers about the intricacies of Pedestrian Hybrid Beacons.

The New Jersey Bicycle and Pedestrian Resource Center (BPRC) works to promote a safer and more accessible walking and bicycling environment in the state. The Center, located at the Alan M. Voorhees Transportation Center at Rutgers, is supported by NJDOT through funding from FHWA. Further information technical assistance, resources for Complete Streets, and current research is available on the BPRC’s website.


Resources

Federal Highway Administration. Pedestrian Hybrid Beacons. Federal Highway Administration. https://safety.fhwa.dot.gov/provencountermeasures/ped_hybrid_beacon/

New Jersey Bicycle and Pedestrian Resource Center. (2020). Evaluating the Pedestrian Hybrid Beacon’s Effectiveness: A Case Study in New Jersey. New Jersey Bicycle and Pedestrian Resource Center. http://njbikeped.org/portfolio/evaluating-pedestrian-hybrid-beacons-effectiveness/

NJDOT Tech Transfer. (2019). What is a Pedestrian Hybrid Beacon? NJDOT Tech Transfer. Video. https://www.njdottechtransfer.net/2019/09/27/njdot-safety-countermeasures-videos/

NJDOT Tech Transfer. (2020). STEP-Aligned HAWK Signal Installed in Bergen County. NJDOT Tech Transfer. https://www.njdottechtransfer.net/2020/03/20/step-aligned-hawk-signal-installed-in-bergen-county/


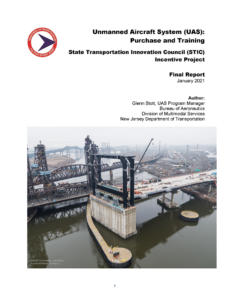
Launching the UAS Program: STIC Incentive Funding Grant – Final Report

Click for report

Unmanned Aerial Systems (UAS), or drones, were promoted by the Federal Highway Administration (FHWA) as one of the Every Day Counts Round 5 (EDC-5) innovations. In 2017, the NJDOT Bureau of Aeronautics applied for and received a NJ State Transportation Innovation Council (STIC) Incentive Program Funding grant to purchase equipment and provide training to evaluate the use of UAS for applications within NJDOT. Prior research had determined that this innovative technology could improve safety and efficiency and reduce costs.

The final report, Unmanned Aircraft System (UAS): Purchase and Training, describes the use of the STIC funding to assist in establishing the UAS program within the Bureau of Aeronautics.  The report describes the training curriculum and two use cases — high mast inspection and traffic incident management — and offers lessons learned and best practices.

The STIC grant, in combination with two other grants, enabled the Bureau to advance UAS within NJDOT. The innovation is now considered institutionalized within the agency.  A video, Drone Technology at NJDOT, highlights the efforts to launch and integrate UAS in NJDOT operations.

FHWA offers up to $100,000 to each STIC each year. You can find out more about the STIC Incentive Program here.

Ultra-High Performance Concrete for Bridge Preservation and Repair: NJDOT Example Featured

This article first appeared in the FHWA’s EDC News Weekly Newsletter of April 29th, 2021 and featured how NJDOT has applied UHPC for bridge preservation and repair.

In the final week, we’ll highlight the New Jersey Department of Transportation (NJDOT), which has recently used UHPC in multiple projects for bridge P&R.

NJDOT was familiar with the benefits of UHPC compared to conventional concrete through its use in field cast connections for precast bridge decks for re-decking projects. NJDOT had been looking for a new overlay preservation system for aging bridge decks that would enhance and extend the service life of their existing structures. However, the NJDOT had not used UHPC as a bridge deck overlay. NJDOT decided to install three UHPC bridge deck overlays as part of a research project contract. One of these projects, which was completed on a bridge spanning the Newark Turnpike, included both a UHPC bridge deck overlay and field-cast UHPC joint headers.

This curved 3-span bridge, originally built in 1979, feeds nearly 30,000 vehicles per day from the New Jersey Turnpike onto I–280. The heavy traffic and the impact of de-icing salts resulted in corrosion of the reinforcing steel in the existing bridge deck, as well as the deterioration of all abutment and pier expansion joints.

Prior to installation of the UHPC overlay and field cast UHPC headers, the existing asphalt overlay was removed, as were the deteriorated expansion joints. A new UHPC header expansion joint solution was installed, and after installation the finished UHPC overlay was covered with asphalt. The resulting 340-foot UHPC overlay is currently the longest continuous overlay installation in North America.

The overlay and the other two installations included in the project showed that preserving bridge decks with a UHPC overlay will provide NJDOT with durable, long-lasting bridge decks and will extend the service life of the structures. Additionally, the bridge overlays showed that UHPC overlay construction methods can minimize traffic interruptions and shorten the total construction time.

Post card style image reads: Built a Better Mouse Trap: National Recognition Program for Transportation Innovation

ANNOUNCEMENT: NJLTAP – Innovating at the Local Public Works Level: Can you Build a Better Mousetrap? (Webinar)

The New Jersey Local Technical Assistance Program (NJLTAP) will host a webinar on the FHWA’s Build a Better Mousetrap program’s collaboration with local technical assistance programs across the country.  

The webinar will present examples of new tools and processes that have been developed and celebrated by the program—innovations that reduce cost, increase safety, and contribute to a more efficient transportation system.  

The event will be held on Wednesday, August 25, from 10am to 11am. Those interested in attending may register here.  

Reads: Lunchtime Tech Talk! The NJDOT's Pavement Support Program (PSP), Goals, Deliverables, and the Future, Thursday July 22, 2021, 12pm to 1:15pm

Lunchtime Tech Talk! WEBINAR: NJDOT’s Pavement Support Program—Goals, Deliverables and the Future

Dr. Thomas Bennert, of the Center for Advanced Infrastructure (CAIT) at Rutgers University, presented on Thursday, July 22, on his work leading the Pavement Support Program (PSP) for NJDOT’s Pavement & Drainage Management and Technology Unit. Dr. Bennert discussed in detail PSP’s current research and applications, explaining how a variety of innovative materials and technologies are being developed and applied to improve pavement performance across the state.

Dr. Bennert's talk provided an overview of the pavement program’s recent deliverables, as well as highlighted the future goals of the program. The PSP has several objectives and touches upon many disciplines from materials evaluation to supporting pavement management activities to addressing pavement design needs to assisting in training and workforce development. The PSP serves as an extension of the NJDOT workforce activities under the direction of the Pavement & Drainage Management and Technology Unit at NJDOT, which also helps to support the needs of the NJDOT Materials Bureau to inform materials characterization for more accurate pavement design and evaluation.

Since 2006, the PSP has assisted NJDOT through research and technical assistance related to pavement performance. Because of this continual, fifteen-year operation, data is available today that demonstrates the positive effects of the program’s work, such as how various asphalt composites have performed over time in comparison to traditional asphalt mixes.

Slide reading NJDOT Pavement System, how it's going. A bar graph of deficient, fair, and good pavement statuses, with deficient tending down since 2006, and good trending upwards.

Data indicates a steady upward trend in the condition of New Jersey’s highway pavement, due to the sustained implementation of PSP’s research and deployment of various pavement preservation treatments

Dr. Bennert organized his talk by the seven major support tasks of the PSP, highlighting the purpose, examples and upcoming activities for each task. For the program’s first task, Innovative Materials, the program has focused on the development and improvement of specifications for roadway pavements, such as asphalt and concrete, to extend the life of the pavement. High Performance Thin Overlay (HPTO) was one of several examples whose purpose, design attributes and benefits were discussed. This pavement treatment improves rut and crack resistance, and extends the life expectancy of some pavements by over five years.

Dr. Bennert also touched on the rationale and challenges of applying another materials innovation, High Friction Surface Treatment (HFST), which was promoted as an FHWA Every Day Counts (EDC) initiative in 2015. While horizontal curves make up only 5 percent of U.S. roadways, more than 25 percent of total roadway fatalities occur on these sections. One way to increase friction in these areas is to apply an HFST, though the pavement must be in good condition. In New Jersey, rapid temperature swings can affect the epoxy on degraded asphalt, creating shallow potholes. To counter this failure, Dr. Bennert and his team have developed both a pre-screening protocol to determine whether a curve is suited for HFST, and a different adhesive more suited to asphalt.

Slide reads Task 2 - Pavement Bonding (Tack Coats & Bond Strength Test), with immages of defromed pavement. A graphic shows how tension between two layers of pavement that are not properly bonded creates space for friction. Bullet points read: Pavement construction requires construction layers in "lifts." Pavement design is conducted assuming layers are "fully bonded," Poor bonding in HMA layer is associated with, reduced fatigue life, increased drutting, and slippage, cracking, and instability.

The program team developed ways to improve pavement bonding in roadway construction

PSP is also tasked with researching innovative practices and technologies to improve the efficacy of the paving process. One example that Dr. Bennert shared involved researching ways to improve the pavement bonding. Two common problems are slippage, where the top layer does not adhere properly and begins to slide away, and more widespread tension issues, in which failure to bond causes uneven loads, warping the pavement. To avoid premature failure, the program has developed performance-based specifications for tack coats (the term for the adhesive layer between tiers of asphalt), a testing mechanism to better understand the properties of tack coats, and new criteria for construction practices to ensure that pavement is put together properly.

The PSP includes a pavement management system support task to assist NJDOT in the collection of data, the management and quality control of data, and the application of data to inform decision-making priorities. For example, the NJDOT Pavement Management group conducts yearly pavement condition assessments to help forecast needs of pavement activities and funding allocations to optimize budgetary resources for pavement preservation and larger rehabilitation and reconstruction projects. This process uses Pavement Management Systems (PMS) condition and program mapping, and future work is expected to continue to incorporate GIS mapping models to create an even more comprehensive picture.

Until recently, the status of the state’s many miles of pavement has been historically performed using an employee’s vision and judgment. Instead, PSP is looking to deploy cameras and computer-based processing power along roadways to automate data collection for developing surface distress index ratings, and even to calibrate and predict the infrastructure’s future performance to inform Pavement Design.

Slide is a map of New Jersey with colored lines across its roads, reflecting pavement conditions. Text to the left reads Developing Visual Tools that NJDOT PMS can utilize for programming and reporting, Construction programming, Planning, Pavement Preservation, and Rehab and Reconstruction

New methods in data collection and mapping allow for a more comprehensive picture of pavement conditions across the state

Finally, PSP engages in policy analysis, develops white papers on current and emerging practices, and provides technology transfer and trainings for NJDOT. Such work includes Cost Benefit Analyses (CBAs) to determine the cost effectiveness of new materials, tackling the question of whether the additional costs to manufacture can be justified by the additional years added to the roadway’s life cycle. Dr. Bennert shared slides showing how CBAs of HPTO and several other hybrid asphalt mixes had higher Benefit/Cost Ratios than traditional Hot Mix Asphalt (HMA). The program engages in trainings and presentations with NJDOT regularly, presenting on research and technological innovations, and facilitating technology transfer and continuity for newer staff.

Dr. Bennert concluded his presentation by commending NJDOT as a national leader in performance testing for asphalt and handling of composite pavements. The Pavement Support Program will continue to address the immediate needs of the Pavement & Drainage Management and Technology Unit at NJDOT, sustaining their research, development, and implementation of cutting-edge pavement technologies. “What we’re doing here is making a big impact in the state.” Dr. Bennert said.

Afterward, Dr. Bennert answered audience questions in a brief Q&A.

Q. How does New Jersey compare to other states in our use of high performance thin overlay (HPTO)?
Dr. Bennert: We’re working with FHWA on the EDC-6 rollout of HPTO. We use it significantly more than most states, besides Texas. New Jersey is a leader on performance testing in general.

Q. How widespread is the use of the High Friction Surface Treatment (HFST) in New Jersey?
Dr. Bennert: While I don’t have the crash reduction data, I do know that it’s been used successfully by the state and some municipalities as well. As shown earlier, there have been some failures with the technology’s application, which we are now working to identify the reasons for failure and reduce through our research.

Q. As reported in the HFST guidelines, why do you think an early drop in skid resistance was observed in the treatment’s application, despite the very hard aggregate that was used?
Dr. Bennert: Simply, it is due to the material loosening in the epoxy. The embedment depth of that aggregate is very important. If it’s too deep, the aggregate is almost drowning in the epoxy, and if it too shallow, it can pull out very easily as vehicles travel over it. The recommendation is to monitor the HFST over the first few years. Because HFST has a limited shelf-life, monitoring friction is very important.

Q. How many sub-consultants do you have on this project, and which private consultants are contracted as sub-consultants?
Dr. Bennert: Currently, the only group that we have working with us on the contract this year is the company that manufactures the software for the pavement management system. This can change based on the needs of Pavement & Drainage Management and Technology Unit at NJDOT.

Q. Could you speak on pavement mix testing for future climate concerns?
Dr. Bennert: We have tests and thresholds for how the material should be performing, and additional heat will often stiffen the material a bit more, which can further age the pavement. We could get some increased, accelerated stiffening. PSP has been working with NJDOT on test methods to identify appropriate asphalt materials and test methods to help identify materials that are prone to aging, which could be especially useful to address climate concerns.

Q. What is the future of Cold Mix Asphalt and its potential use on heavily truck trafficked New Jersey highways?
Dr. Bennert: In New Jersey, we don’t have low volume roads where we could put material out without an overlay. Without some kind of confinement, the material could easily break apart. I’m looking forward to the rollout of central plant technology, which will allow us to take material from a project and put that back, an almost 100 percent recycling of the material for a project’s base application. This would be a base application to help reduce the recycled asphalt pavement stockpiles in the state.

Q. Did you test Ultra-Thin Friction Course and how does it compare to High Performance Thin Overlay?
Dr. Bennert: Ultra-Thin Friction Course can be thought of as a treatment option between an Open-Graded Friction Course and a Chip Seal. It’s used more for pavement preservation, rather than structure, but it does a good job at sealing off the pavement. The High Performance Thin Overlay is thicker, and helps to provide structural integrity of the pavement, both sealing it and adding rutting and cracking resistance. There’s a difference in the thickness of the materials, and the targeted applications.


A recording of the webinar is available here, (or to the right).

Dr. Bennert’s presentation can be found here.

Resources

Federal Highway Administration. Targeted Overlay Pavement Solutions. https://www.fhwa.dot.gov/innovation/everydaycounts/edc_6/targeted_overlay_pavement.cfm

Bennert T. and D. Pezeshki. (2015). Performance Testing for HMA Quality Assurance. Report, Rutgers, Center for Advanced Infrastructure and Technology. FHWA-NJ-2015-010. https://cait.rutgers.edu/wp-content/uploads/2018/05/fhwa-nj-2015-010.pdf

NJDOT Technology Transfer. Pavement Preservation at NJDOT. Video. https://www.youtube.com/watch?v=n1wlnB8AQ-g&t=128s

ANNOUNCEMENT: FY 2021 AID Demonstration Program Information Session

The Federal Highway Administration (FHWA) has announced the FY 2021 Accelerated Innovation Deployment (AID) Demonstration Program and will make up to $10 million in grants will through Notice of Funding Opportunity (NOFO) 693JJ321NF-AIDDP (link). The AID Demonstration program provides funding as an incentive to accelerate the implementation and adoption of innovation in highway transportation. Eligible activities may involve any phase of a highway transportation project between project planning and project delivery, including planning, financing, operation, structures, materials, pavements, environment, and construction. The FHWA will provide AID Demonstration grants to eligible State DOTs, Federal Land Management Agencies, and tribal governments.

Key NOFO Dates

Notice of Intent to Apply Deadline: August 3, 2021: 11:59 pm Eastern Time.
Application Submission Deadline: September 28, 2021; 11:59 pm Eastern Time.

The FHWA will host an AID Demonstration Information Session to provide an overview of the FY 2021 program. Participation is not mandatory in order to submit an application under NOFO 693JJ321NF-AIDDP. However, potential applicants are encouraged to participate. Please join us on July 27, 2021 at 1:00 pm (Eastern Time). There is no registration required to attend the Information Session. To join, simply CLICK HERE to be taken directly to the virtual meeting space. This will be a MS Teams Live Event and will be recorded.

Image of a highway with two cars driving on it, in the distance the erector-set outline of the Pulaski Skyway can be seen.

To Replace Falling Gas Tax Revenues, Eastern States Explore Mileage-Based User Fees

Traditional fuel usage is expected to plummet as the country transitions to zero-emission vehicles (ZEVs).  State and Federal gas taxes, traditionally the predominant source of transportation infrastructure funding, will no longer suffice with this vehicular fleet transition.  In New Jersey, for example, the state’s plans for carbon-neutrality by 2050, will eliminate the roughly $2 billion generated from gas taxes each year—funds that are needed to keep our roadways in a state of good repair. One solution, proposed by the Eastern Transportation Coalition, is a mileage-based user fee (MBUF), which generates revenue by miles traveled, instead of gallons of fuel purchased. An MBUF could ensure that electric vehicle (EV) users pay their fair share for the upkeep of New Jersey’s roads.

To solve this looming funding gap, a consortium of states along the Atlantic seaboard, collectively known as the Eastern Transportation Coalition, are working to engage with the public on, and study the possibility of, implementing a Mileage Based User Fee (MBUF).  The organization is currently piloting multiple programs for both freight and passenger vehicles, including a study involving New Jersey drivers that concluded in late 2020.

Document cover, in white and blue, reading The Eastern Transortation Coalition (Formerly the I-95 Corridor Coalition) Mileage-Based User Fee Exploration 2019 Passenger Vehicle Pilot, Final Report, March 01, 2021

The Mileage-Based User Fee Exploration is one of several studies by the Eastern Transportation Coalition examining how to make up a loss of gas tax revenue. Courtesy The Eastern Transportation Coalition

In March, 2021, the Coalition published a detailed report containing findings from a 2019 Passenger Vehicle Pilot in Delaware and Pennsylvania. The study was funded by a grant from the United States Department of Transportation’s Surface Transportation System Funding Alternatives (SFSTA) program. While the pilot was based in Delaware and Pennsylvania, the 889 participants represented fourteen member states, including New Jersey, and the District of Columbia.

The organization gave participants an option for how their miles would be tracked. Using a device provided by a vendor, Azuga, they had the choice of a sensor with geo-positioning functions, or one without, which would use a predefined estimate to determine mileage allocation. Location services for such a tracker are essential for the East Coast region, where interstate travel is more frequent. Out of the 3.13 million miles pilot program participants drove, 13 percent of miles were outside of their home state.

Both devices included “value-added” features, which collect data on vehicle health, driver performance, trip logs, and battery performance. At the end of the study, a majority of respondents indicated that they appreciated these features.

To estimate charges, the Coalition created a miles-traveled tax rate for each state, multiplying the state and federal gas tax average by monthly mileage, with an additional 20 percent rate multiplier to cover projected administrative costs. For example, a New Jersey driver with an average fuel economy vehicle driving 1,000 miles per month would pay $87.64 under the MBUF—or about a cent more than they currently pay in state and federal gas taxes. However, under the program, a driver with a hybrid car, such as a Toyota Prius, would be required to pay an additional $10.43. For an EV driver, who currently avoids paying the gas tax entirely, the MBUF program would obligate them to pay $18.69 a month toward road maintenance for the same distance. (See figure below). The organization provides a mileage calculator for members of the public to explore how much they would pay under the proposed system.

From Left to Right: Milage calculator tool for MBUF for average vehicle with 23 Miles per gallon, they would pay about one cent more in fees to drive 1000 miles. Second: Hybrid mileage calculation for 1000 miles with 2018 toyota prius, they would pay $10.43 more under MBUF than the $38.76 they currently pay, and third and finally: Mileage calculation for EV driving 1000 miles, they would have to pay an extra $18.69, and are paying $0 now using traditional gas tax.

From left to right, an average vehicle, hybrid vehicle, and electric vehicle and their respective MBUF costs. Courtesy The Eastern Transportation Coalition

During the pilot program, the Coalition conducted surveys before and after, and held focus groups with participants, to gauge changes in perception. One survey found that 70 percent of New Jersey respondents thought that transportation funding is growing or the same, despite falling gas tax revenues. By the end of the test period, 85 percent of participants said that the MBUF device was helpful and easy to use, and concerns about privacy dropped by nearly half.

From 2018-2019, the organization conducted a study with freight vehicles, forming a Motor Carrier Working Group (MCWG) with industry partners. The pilot included 55 tractor-trailers that traveled a total of 1.43 million miles over the six-month period. The overall conclusion was that trucks themselves are varied, and, as a class, entirely dissimilar to cars. Trucks typically include trackers as part of the International Fuel Tax Agreement (IFTA), a tax redistribution system, and the International Registration Plan (IRP), which calculates registration fees according to fleet distance through various jurisdictions. However, such a system would be incompatible with MBUF because it lacks revenue collection tools, location services, and consistent implementation. This study found that the MBUF must be adjusted to the type of vehicle and service it provides, or else it unintentionally privileges certain carriers. To further gauge the intricacies of MBUF for commercial trucking, the Coalition began another freight truck pilot in the fall of 2020 with 200 vehicles.

The Eastern Transportation Coalition summarizes six key takeaways from their last four years of studies as follows:

  • More outreach is necessary to increase public awareness of the funding gap.
  • The transition to any new funding mechanism will be difficult.
  • Privacy concerns were dispelled after testing the new technology.
  • MBUF would relieve the disproportionate share of maintenance costs borne by rural drivers with inefficient vehicles.
  • Freight trucks require a program tailored to them, and cannot be considered the same as cars.
  • People were generally in favor of the MBUF model, but more education about its importance and functionality is needed.

image of a blue eighteen wheeler with a long white trailer driving on a highway with trees losing their leaves on an overcast day.

The Coalition's studies have demonstrated that MBUF for freight must be tailored to type and service. Joseph Paul | Unsplash

Dr. Patricia Hendren, Executive Director of the Eastern Transportation Coalition, shared these findings with the Senate Committee on Environment and Public Works in April, 2021. Dr. Hendren stressed that a federally-led, national education campaign about dwindling transportation funding was necessary, to boost public awareness about this growing concern. In addition, the executive director advocated for further studies at state and regional levels of both passenger and commercial vehicles, to ensure that that such a transition will be equitable, efficient, and have strong public support.

It is certain that a switch from the traditional gas tax funding system is necessary to maintain America’s road infrastructure, and mileage-based user fees are a promising mechanism for doing so—one way to ensure that everyone pays their fair share.


Resources

The Eastern Transportation Coalition. (June, 2020). Findings from the Nation’s First Multi-State Truck Mileage-Based User Fee Pilot The Eastern Transportation Coalition. https://tetcoalitionmbuf.org/wp-content/uploads/2020/08/2018_2019-Coalition-Truck-Pilot-Factsheet_FINAL.pdf

The Eastern Transportation Coalition (March, 2021). Mileage Based User Fee Exploration: 2019 Passenger Vehicle Pilot. The Eastern Transportation Coalition. https://tetcoalitionmbuf.org/wp-content/uploads/2021/03/TETC-2019-Passenger-Vehicle-Pilot-Report-1.pdf

The Eastern Transportation Coalition. (March, 2021). Six Things to Know About Mileage-Based User Fees. The Eastern Transportation Coalition. https://tetcoalitionmbuf.org/wp-content/uploads/2021/03/TETC-March-2021-Fact-Sheet.pdf

The Eastern Transportation Coalition. (April, 2021). Testimony of Patricia Hendren, Ph.D., Executive Director, the Eastern Transportation Coalition. The Eastern Transportation Coalition. https://www.epw.senate.gov/public/_cache/files/3/b/3b09198c-a0b3-4d41-b7ad-f21ae38c9579/C45ABD53D65A339B09EDF69FC3A367A0.04-14-2021-hendren-testimony.pdf

The Eastern Transportation Coalition. What Could it Cost? The Eastern Transportation Coalition. https://tetcoalitionmbuf.org/mbuf-cost/

Image reading WEBINAR Lunch Time Tech Automating the Traffic Signal Performance Measures for NJDOT Adaptive Traffic Signal Control Systems

Lunchtime Tech Talk! WEBINAR: Automating Traffic Signal Performance Measures for NJDOT Adaptive Traffic Signal Control Systems

Slide Cover Reading Lunchtime Tech Talk! Automating the Traffic Signal Performance Measures for NJDOT Adaptive Traffic Signal Control Systems - Real-Time Signal Performance Measurement (RT-SPM)

Click For Tech Talk Presentation

The New Jersey Department of Transportation Bureau of Research convened a Lunchtime Tech Talk! Webinar on Automating the Traffic Signal Performance Measures for NJDOT Adaptive Traffic Signal Control Systems on June 29, 2021. The presentation was led by Dr. Peter Jin, of Rutgers-CAIT, Dr. Thomas Brennan, from the College of New Jersey, and Kelly McVeigh from NJDOT’s Mobility Engineering Unit. The three touched upon Phase I research on Real-Time Traffic Signal Performance Measurement and continuing research underway in Phase II  to adapt NJDOT’s existing signaling technology to take advantage of innovative methods in optimizing traffic controls.

Kelly McVeigh, of NJDOT, began the event by introducing the Automated Traffic Signal Performance Measures (ATSPM) and Adaptive Traffic Signal Control Systems (ATSC) concepts. According to McVeigh, Automated Traffic Signal Performance Measures are a suite of measures that help transit agencies to make use of data in optimizing signal timings. ATSPM consists of a dataset of time-stamped events—visually represented through charts—that demonstrate the signal’s performance. For example, how much time the signal is set to green when vehicles are present. The technology, McVeigh said, was “a powerful tool in the toolbox for traffic engineers to monitor performance and even make changes, if agency procedures allow.” ATSPM was first introduced by FHWA as part of the fourth round of the Every Day Counts Initiative (EDC-4).

Slide Reads Challenges with Standard ATSPM Deployment, Standard ATSPm Deployment: High-resolution controllers, data probe and FTP configuration at Signal Boxes. Challenges: Upgrading to high-resolution controllers requires significant investment, $4,000 to $5,000 dollars per intersection. Opportunities: Centralized event logs of Adaptive Signal Control Technology systems. Rapid expansion of ASCT systems. Objectives: Integrate ATSPMs and Adaptive Signal Control Technology )ASCT) systems to produce ATSPM performance metrics. Policies: Dynamically adjust the signal timing in real time in practice. Timing changes (long-term) versus ASCT (real-time/short-term).

In order to avoid costly infrastructure costs of replacing ASCT systems for ATSPM equipment, the researchers devised a method to make use of existing, deployed intersection systems.

McVeigh explained that, while there is already a well-documented system in place to support ASTPM implementation, NJDOT is focusing on adapting existing systems that are already equipped to capture data. Adaptive Traffic Control Systems (ATSC) are installed in nearly 20 percent of NJDOT’s roughly 2,500 signals statewide, and collect data on both traffic controllers and detectors, such as signal performance and vehicle queuing. However, as Dr. Jin then detailed, ATSC data is presently incompatible with ATSPM. In addition, some signals are connected to the centralized network, while others remain isolated. The solution was to develop a means of converting the data, rather than installing new infrastructure.

A team of students from Rutgers, The College of New Jersey, and Rowan University worked with Dr. Jin to bridge data from ATSC to ASTPM. The proposed solution is a program that automatically retrieves traffic controller event logs and then translates them into ASTPM event code, a method that is agnostic to controller type. This allows for a wide variety of data to be collected, and then viewed and optimized using standard ASTPM methods.

Slide image of proposed farmework with a new add on of existign ASCT Sytems going ot get event logs, to ASCT event translator to push ATSPM events, to Database server. The two bullet points read The Newly developed program can automatically retrieve the controller's logfiles and translate records ito standard ATSPM event code. This method is agnostic to the controller type.

The proposed framework would add direct conversion of ASCT events to ATSPM.

Data translation works by taking ATSC logs, such as “Phase Begin Green” stamped with a timecode, and converting that to a numeric code, in this case, “1.” A computer program reads through the SCATS log and assigns certain datapoints to traffic events, such as a gap, which would be coded as “4.” At the conclusion of Phase 1, the team has been able to convert all major events to ASTPM metrics. Going forward, they are working on using geolocated video data to reconstruct stopping data, allowing for more refined information that enables real-time traffic signal adjustments.

Many locations on NJDOT’s network are not properly equipped to convey upstream information on vehicles, particularly during the red phase. The ingenious solution is to locate a “Stop-Bar” within the signal detector that registers when vehicles have begun queuing. This data is then correlated with spatial Google Maps data that precisely locates the vehicles’ position. Information from the Autoscope video-based tracking technology is then used to calculate the vehicle’s trajectory, using the Shockwave Theory of traffic flow. The benefit of such a method is better data on how vehicles approach a red signal, which can then be optimized through ASTPM.

Reads event Translator method, converted signal events will be imported into this ATSPM database. Following this, the ATSPM software can generate performance metrics and produce visualization to suppport maintenance and operations. Table shows signal timing and phase-related event and code used by ATSPMs.

ASTC events are translated using a computer program that can recognize various events and code them as such.

Dr. Brennan then demonstrated the technology in action, sharing his screen to show the ATSPM Server and its variety of tools. He selected a sample intersection, US-1 and Harrison Street near the Millstone River, and brought up a chart showing the Purdue Phase Diagram (PCD). The PCD is a means of graphically representing the number of vehicles passing through an intersection with respect to phase time. In an ideal situation, vehicles should arrive on green, instead of red, when they will have to wait. Another chart represented the traffic split by time of day and duration of the phase. When the technology is fully implemented, such data should be uploaded every 15 minutes, allowing for near real-time monitoring.

From the ATSPM data, Dr. Brennan showed that one signal had an 82 percent Arrive on Green (AoG) score. Metrics such as this could be used for the development of data-driven policy. The dashboard charts also showed vehicle density for when the signal was about to turn red—the timing of which could be adjusted to lighten the number of vehicles queuing.

Screenshot image of a white website with a blue graph, showing dark blue and red squiggles, which are traffic flow data at the intersection throughout the dat. Above, Dr. Tom Brennan can be seen explaining.

A live demo of the converted ATSPM dashboard demonstrated how useful the technology will be for making intersections more efficient.

It was clear that the conversion of ATSC data to ATSPM dramatically expanded the potential of every intersection in which it is equipped. The dashboard could be used to model changes in traffic flow, such as if a road diet were implemented, or if traffic from a major highway was diverted through the intersection. Safety benefits include data on red light violations that can be tabulated and used as justification for future improvements. One day data from connected vehicles could be integrated, too.

At the end of the presentation, Dr. Jin summarized their work: the team had innovated in converting raw data to ASTPM protocols that could then be used to boost signal performance and traffic flow optimization. This translation method avoids the intensive infrastructure cost of upgrading signals to ASTPM standards, saving money. An in-development model using Stop-Bar data will soon allow for real-time signal adjustment, letting traffic engineers tweak signal timings for optimal flow. At NJDOT, they are in the final stage of deploying this technology permanently on an agency server for future widespread use.

At the end of the event, several attendees asked questions through the platform’s chat feature.

Q. Inrix data does not provide individual probe data, how is it accounted for in the results?
Dr. Brennan: We’re not able to get individual vehicles, but it aggregates vehicle speed within one-minute increments. This then feeds that into ASTPM as if it were a single detector. Everything is within a confidence interval of 85 percent. The beauty of this software is that as long as you convert your information into the right format, you can put it in there.

Q. How do you control and change the cycle length tool?
Mr. McVeigh: Part of the adaptive system algorithm is to update cycle lengths in real time, based on the data being received. We can also provide guidance to the system on thresholds, on minimum and maximum lengths for cycles throughout the day. This is all for adaptive systems—coordinated systems use modeling to update their lengths. The tool used primarily at NJDOT is Synchro.

Q. How did the COVID-19 pandemic affect the data collection on Route 1?
Dr. Brennan: Because the researchers were working to calibrate a tool, the volume of traffic on the roadway did not affect their work.

Q. What are the biggest obstacles that you are facing in advancing this innovation around the state?
Mr. McVeigh: The first obstacle is ensuring that various datasets can be interfaced properly, because the ATSC system is providing data that is not necessarily compatible with ASTPM functions.
Dr. Brennan: There are also issues with code syntax, such as when SCATS is updated and logs data differently. Thanks to the graphical nature of the project, it is easy to see when this is happening.

Q. Did you face any issues in reconciling the Google Maps data with the CCTV data?
Dr. Jin: I think it was more with the video conversion. Google Maps provided good distance information that was then converted to become compatible with the video data. The critical step was coordinating these pixel coordinates to actual coordinates.

Q. What percentage of the adaptive signals are implemented on state highways?
Mr. McVeigh: Right now we have 118 adaptive signals in operation. Out of almost 2,600 signals in the state, a little under 20 percent of signals in the state are equipped with this technology.

Q. With multiple data sets fed into the system, how does it filter to avoid repetitions or duplicates?
Dr. Jin: We do have to filter the data that is fed in, and also have developed the logic that shows which line confirms the event occurred, and which line shows the starting point of the event. This is part of the translator work. In terms of different data sources, we were able to coordinate pretty well.

Q. Do you have any suggestions based on your research to help county and local governments advance the implementation of ASTPMs?
Mr. McVeigh: It’s a very powerful tool, make sure you have the practice to enable it to be used properly. From a technical standpoint it’s relatively straightforward, but the big thing is knowing how you want to use it—could be really effectively used as an empirical optimization tool. It all depends on the agency’s ability to do that.
Dr Jin: It is important to start knowing what is currently available, whether there is new construction or existing controllers, to see whether can deploy original ASTPM or these adaptive measures.
Dr. Brennan: It’s important to have strong IT support for these conversion activities. It’s not impossible, but necessary to have the support in place.

A recording of the webinar is available here, (or see right).

Resources

Federal Highway Administration. Automated Traffic Signal Performance Measures. https://ops.fhwa.dot.gov/arterial_mgmt/performance_measures.html

NJDOT Tech Transfer. (2018, December). What is an Automated Traffic Signal Performance Measure (ATSPM)? https://www.njdottechtransfer.net/automated-traffic-signal-performance-measures/

NJDOT Tech Transfer. (2020, June 12). Development of Real-Time Traffic Signal Performance Measurement System. https://www.njdottechtransfer.net/2020/06/12/development-of-rttspms/

Developing Next Generation Traffic Incident Management in the Delaware Valley

Traffic Incident Management (TIM) programs help first responders and traffic operators to better understand and coordinate roadway incidents. As part of the sixth round of the Federal Highway Administration’s (FHWA) Every Day Counts (EDC) initiative, the agency is promoting innovative practice in this area through NextGen TIM. These practices and procedures can advance safety, increase travel reliability, and improve agency operations by engaging with new technologies and trainings. For example, sensors and crowdsourced data can help traffic agencies better detect incidents and decrease response times. Drones, or Unmanned Aerial Systems (UAS) can help transportation agencies and first responders better understand the incident scene and speed the resumption of traffic flow. The NextGen TIM initiative is an effort to improve traffic incident management through technological innovation and standardized operating procedures. NextGen TIM technologies and practices are currently being used in the Delaware Valley to increase real-time situational awareness and ensure maximum safety at the scene of an incident.

Regional Integrated Multimodal Information Sharing (RIMIS)

Image of RIMIS Operational Tool, which is a map of the DVRPC region, with Philadelphia at the center, and portions of New Jersey to the east, and Pennsylvania to the West, highway routes are marked in green and yellow, yellow denoting slower than usual operations, orange construction worker signals denote construction along the corridor, many of them are clustered aroudn Philadelphia.

The RIMIS Operational Tool gives a system-wide overview of traffic operations, such as incidents, traffic flow, and construction alerts, courtesy DVRPC

Currently, transportation departments in the region use the TRANSCOM traffic monitoring platform to supervise incidents. The Delaware Valley Planning Commission (DVRPC)’s version of this platform is called RIMIS, or Regional Integrated Multimodal Information Sharing. Because DVRPC is a Metropolitan Planning Organization (MPO) that spans both sides of the Delaware River, its reach includes sections of New Jersey and Pennsylvania—broadly, the greater Philadelphia area. In this region, with overlapping municipal, state, and regional jurisdictions, communication and coordination could be difficult. According to Christopher King, Manager of DVRPC’s Office of Transportation Operations Management, before RIMIS, incident notifications were commonly communicated through phone calls.

Area transportation officials recognized the need for a coordinated platform where information could be shared back and forth. Instead of slow, one-to-one incident notifications, this new, decentralized platform would present a “big picture” perspective of a traffic incident’s impacts on the regional transportation network. The concept was to create a regional centralized information location for traffic operators and first responders to view the traffic status on area roads, and understand, quickly and reliably, where an incident has occurred. Local agencies could access the platform to better understand incident conditions.

Image of 16 video feeds, each of a different stretch of highway, a video wall for traffic operations monitoring.

The RIMIS Video Wall allows for real-time roadway monitoring for first responders and traffic operations personnel, courtesy DVRPC

RIMIS was first developed nearly 20 years ago, and has proved to be invaluable as a resource. Participants supply data, such as video feeds and traffic updates, which is then aggregated to update other members. These agencies include PennDOT, NJDOT, SEPTA, and NJ TRANSIT. Member agencies and municipalities, such as Bedminster Township, PA, can take advantage of the operations database, with live and historical traffic flow and incident data, a situational map which geographically represents traffic levels and incidents across the region, and a video wall of roads in the DVRPC area with live camera feeds.

As an example, Mr. King showed a municipal fire department participating in RIMIS, that, once alerted that a collision has occurred, can access the platform’s interactive map, live video feeds, and information on planned interruptions, to better understand the scene before arriving there. The RIMIS platform gives context to first responders on route to an incident, provides a broader view for traffic operations dispatchers managing a disruption, and also assists transportation planners looking for data on how to improve a high-collision roadway.

Interactive Detour Route Mapping (IDRuM)

Image of a map of Philadelphia, with highway routes in orange, delineated into sections. Each section, when clicked on, shows two detour routes in the event of a serious incident.

IDRuM is a detour resource for rerouting traffic after major incidents, courtesy DVRPC

Another TIM tool DVRPC provides is the Interactive Detour Route Mapping (IDRuM) feature, a web application that consolidates established Emergency Detour Routes as a resource for traffic operations personnel, first responders, and transportation planners and engineers.

If, for example, an incident has occurred on a certain segment of I-295 in Bucks County, then the Primary Detour Route would involve taking Taylorsville Road south and turning right on State Route 322 to rejoin the highway, while the Secondary Detour Route would take a similar maneuver going north. This information can be easily accessed in both interactive and PDF formats on the IDRuM mapping site.

Image of two detour routes from I-295, one goes on a road to the north and then southeast to rejoin the highway, the other to the south and then northwest.

DVRPC is currently beta testing detour routes from NJDOT for the IDRuM platform, courtesy DVRPC

DVRPC is currently working to integrate NJDOT’s designated Detour Routes into the GIS map for the area east of the Delaware. The data has been uploaded, but is still in beta testing.

NextGen TIM

Mr. King says that a chief focus of NextGen TIM is to expand services such as RIMIS and IDRuM to more localities and arterial routes, as well as to ensure that all first responders are trained in the most up-to-date TIM techniques, such as how to position their vehicles for maximum safety on an active roadway.

During the second round of the Every Day Counts Initiative (EDC-2, 2013-2014),  a TIM process and training program was established under the  SHRP2, or the second Strategic Highway Research Program. This laid the groundwork for the current TIM training and organizational infrastructure, which is NJTIM in the Garden State. This consortium, spearheaded by NJDOT, provides resources and trainings to teach best practices to first responders across the state. NJDOT and the New Jersey State Police (NJSP) partner together to promote trainings and coordinate highway emergency response. To learn more about NJDOT’s efforts with regards to partnering with NJSP on crash data consolidation, using Unmanned Aerial Systems for incident analysis, and other aspects of the initiative, please visit NJDOT Tech Transfer’s NextGen TIM page.


Resources

Delaware Valley Regional Planning Commission. Interactive Detour Route Mapping (IDRuM). https://www.dvrpc.org/transportation/tsmo/idrum

Delaware Valley Regional Planning Commission. Regional Integrated Multimodal Information Sharing (RIMIS). https://www.dvrpc.org/Transportation/TSMO/RIMIS/

New Jersey Department of Transportation. Statewide Traffic Incident Management Program. https://www.nj.gov/transportation/commuter/motoristassistance/stimp.shtm

New Jersey Traffic Incident Management. Traffic Incident Management Resource Portal. http://www.njtim.org/NJTIM/