


Project Bundling Webinar Series
The Federal Highway Administration (FHWA) has provided webinar recordings as part of ongoing support for the EDC-5 Project Bundling Initiative. While project bundling is not an entirely new concept, these trainings share best practices and advanced methods for the...
Exploring Strategic Workforce Development: An Interview with NJDOT’s Human Resources
Strategic Workforce Development, an FHWA Every Day Counts (EDC) Round 6 innovative initiative, anticipates collaboration between government agencies, trade organizations, private agencies and communities to prepare individuals for the construction workforce. The...
FHWA Issued its EDC-6 Progress Report #2
The Every Day Counts Round 6 Progress Report #2 is now available here.Every Day Counts (EDC) is the Federal Highway Administration’s (FHWA’s) program to advance a culture of innovation in the transportation community in partnership with public and private...
NJDOT Tech Transfer Newsletter – March 2022
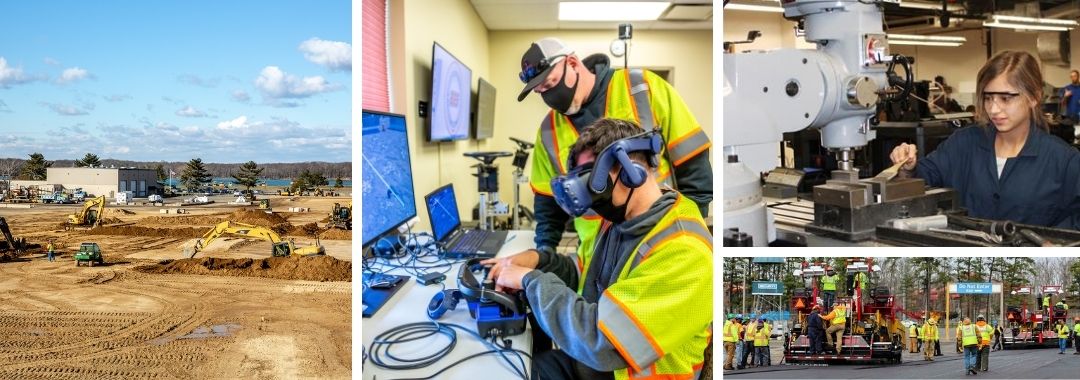
Exploring Strategic Workforce Development in NJ: An Interview with the IUOE Local 825
Strategic Workforce Development, an FHWA Every Day Counts (EDC) Round 6 innovative initiative, anticipates collaboration between government agencies, trade organizations, private agencies and communities to prepare individuals for the construction workforce. The...
 |