


Engaging Youth in Transportation Planning – NJ MPO Efforts Featured
FHWA promotes virtual public involvement and innovative public engagement strategies through its Every Day Counts (EDC-6) innovations. The FHWA’s EDC Newsletter of March 3, 2022 featured the North Jersey Transportation Planning Authority’s creative efforts...
Exploring Strategic Workforce Development in NJ: An Interview with Hudson County Community College
Strategic Workforce Development, an FHWA Every Day Counts (EDC) Round 6 innovative initiative, anticipates collaboration between government agencies, trade organizations, private agencies and communities to prepare individuals for the construction workforce. The...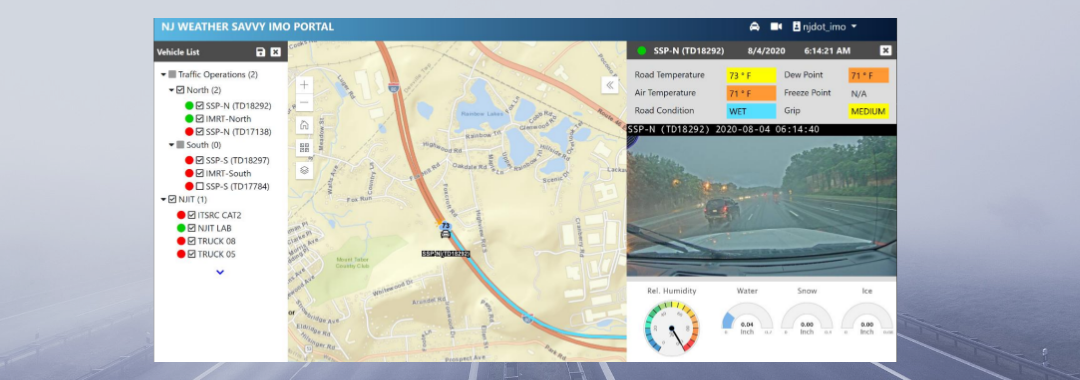
Innovation Spotlight: Testing and Deploying ITS Solutions for Safer Mobility and Operations
NJDOT’s Transportation Mobility unit is working on several initiatives related to FHWA Every Day Counts innovative initiatives, including: Crowdsourcing for Advancing Operations (EDC-4, EDC-6), Next Generation Traffic Incident Management (EDC-4, EDC-6), and...
Exploring Strategic Workforce Development in NJ: An Interview with the Associated Construction Contractors of New Jersey
Strategic Workforce Development, an FHWA Every Day Counts (EDC) Round 6 innovative initiative, anticipates collaboration between government agencies, trade organizations, private agencies and communities to prepare individuals for the construction workforce. The...
Succession Planning Literature Scan
Strategic Workforce Development (SWD) is a model innovation in the latest round of the FHWA Every Day Counts (EDC-6). The NJ STIC expressed the objective to “reinvigorate succession planning programs to address workforce development in managerial skills”...
 |