Get Oriented with EDC-5 Innovations – Webinars and Baseline Report

In June 2018, FHWA announced the fifth round of Every Day Counts Innovations (EDC-5). From September 10-26, 2018, the agency held Orientation Webinars, 90-minute sessions to introduce each EDC-5 innovation area. The EDC-5 website posted webinar recordings, factsheets, and presentation slides following each session.

See the full list of orientation webinars for EDC-5 innovations here.

Every two years, FHWA works with state departments of transportation and other public and private stakeholders to identify innovative technologies that merit widespread deployment. State Transportation Innovation Councils (STICs) in all fifty states then meet to evaluate these innovations and lead deployment efforts.

Innovations for EDC-5 include weather-responsive management strategies, collaborative hydraulics, rural roadway departures, advanced geotechnical exploration methods, unmanned aerial systems (UAS), virtual public involvement, use of crowdsourcing to advance operations, project bundling, Safe Transportation for Every Pedestrian (STEP), and value capture of transportation.

In Fall 2018, transportation leaders and front-line professionals from across the country gathered at five Regional Summits to discuss the EDC-5 innovations, exchange ideas with industry counterparts, and provide feedback to FHWA on resources needed to support innovation adoption.

The NJDOT team attended the Regional Summit in Albany, New York. Following the summits, New Jersey finalized its selection of innovations, established performance goals for the level of implementation and adoption over the upcoming two-year cycle, and initiated its efforts to implement the innovations with the support and assistance of the technical teams established for each innovation.

In the Spring of 2019, the FHWA issued a summary report, EDC-5 Summit Summary and Baseline Report that describes the Regional Summits and indicates the priority innovations for deployment being taken by the individual states.

Quantifying Greenhouse Gas Emissions of Asphalt Pavement Preservation at Construction and Use Stages Using Life Cycle Assessment

Employing pavement preservation techniques can help reduce greenhouse gas emissions, and contribute to savings for both transportation agencies and drivers, according to a recently published study in the International Journal of Sustainable Transportation. The researchers determined that extending the life of pavement through preventive maintenance  can reduce greenhouse gases by 2 percent; save transportation agencies between 10 to 30 percent in spending; and reduce cost for drivers between 2 to 5 percent on fuel consumption, tire wear, vehicle repair, and maintenance because of smoother surfaces (Bates 2019). This research can assist transportation agencies like NJDOT and local public agencies consider the right maintenance strategies when determining environmental effects in future projects.

This research is notable, in part, because pavement preservation has been a hot topic among many state highway agencies.  The Federal Highway Administration’s Every Day Counts (EDC) program brought greater attention to the benefits of pavement preservation by making it one of its national initiatives in the fourth round of the EDC program. Through EDC-4, many states made commitments to increase their use of pavement preservation treatments and give a fuller commitment to its integration in their maintenance programs (FHWA 2018a).

NJDOT has significantly increased its use of preventive maintenance treatments on roadways in good or fair condition in recent years. Applying preventive maintenance treatments early has proven to be cost-effective by slowing the rate of deterioration and allowing NJDOT to reduce the backlog of deficient pavements.  The lead author  for this research, Hao Wang, previously worked as the co-investigator on a NJDOT-funded research study, Appropriate Implementation of Pavement Preservation Treatments, completed in 2015. That study looked at the pavement preservation techniques that NJDOT could use on its high volume state-maintained roads (Wang & Vitillo 2015).

Pavement preservation consists of surface refreshment to alleviate functional indicators of deterioration, such as friction, minor cracking, or oxidation. The three pavement preservation treatments considered in this recently published research were thin asphalt overlay (placing up to 2 inches of asphalt on roads), chip seal (spraying asphalt emulsion on pavement and laying aggregate), and crack seal (filling cracks with rubberized asphalt or polymer-modified asphalt with some filler).

While previous studies have looked at the environmental impact of preservation treatments at the construction stage, few have considered how the change in pavement smoothness affects vehicle fuel consumption and tailpipe emissions. The purpose of this study was therefore to systematically look at both the construction and use stage to determine the environmental impacts of several pavement preservation treatments throughout the whole life-cycle.

In order to quantify the environmental impact, the researchers used life-cycle assessment (LCA), focusing specifically on CO2 emission for global warming potential (GWP). To determine the emissions during construction stage, the group looked at the raw material, manufacturing, transport, and placement.

Illustration of different stages in pavement LCA with system boundary (Wang et  al. 2019)

Researchers measured pavement condition using the International Roughness Index (IRI), which states are required to report to the FHWA as it provides a standardized and objective measurement methodology. IRI models for pre- and post-treatment were then created with data obtained from the Long-Term Pavement Performance (LTTP) program Specific Pavement Studies (SPS-3). The LTTP program was established in 1986, and has been maintained by the FHWA since 1991, with the purpose of collecting and storing pavement performance data in a centralized database (FHWA 2019). SPS-3: Preventive Maintenance Effectiveness of Flexible Pavements specifically compares the effectiveness and mechanisms of selected maintenance treatments to preserve and extend pavement service life, safety, and ride quality (FHWA 2018).

The pavement’s pre- and post-treatment effects on vehicle fuel consumption and air quality were then analyzed using data from the Highway Development and Management Tool (HDM-4) and the Motor Vehicle Emission Simulator (MOVES). HDM-4 is a software package that is used worldwide for analysis, planning, management, and appraisal of road maintenance, improvements, and investment decisions. MOVES is the EPA’s emission modeling system for mobile sources, which is used at all project levels to estimate for criteria air pollutants, greenhouse gases, and air toxics.

The results for the CO2 emissions at the construction stage showed significant differences in energy consumption for the three pavement preservation treatments, mostly due to the varying raw materials and manufacturing processes. Thin asphalt overlay had the highest energy consumption, followed by chip seal, and then crack seal, which requires a comparatively small amount of material over the entire process. Additionally, thin asphalt overlay tends to have a higher cost compared to the other two. At the use stage though, thin overlay showed the highest reduction of CO2 emissions, based on the post-treatment IRI values, and crack seal the lowest reduction.

A machine compacts asphalt over existing pavement at a construction site at John F. Kennedy International Airport in New York City (Wang 2019).

Despite their environmental impacts, the various preservation treatments still had an overall benefit when quantified using a life-cycle assessment approach, according to the researchers. Additionally, they found that the timing of preservation treatment could have a large effect on the subsequent emissions at the use stage. Specifically, for thin overlay and chip seal, the optimal time to achieve maximum life-cycle environmental benefit becomes earlier as traffic volume or initial IRI value increases. Despite the variance in effectiveness over the life-cycle, all three treatments reduced emissions overall.

In explaining the rationale for the research, the study’s authors  note that transportation sector is second to electricity in generating greenhouse gas emissions among all U.S. end-use sectors at 27 percent. Additionally, fuel consumption of vehicles accounted for 83 percent of the total greenhouse gas emissions within the transportation sector in 2015. In December 2018, Governor Phil Murphy announced that New Jersey would be rejoining the Regional Greenhouse Gas Initiative, a group of neighboring states that have set policy goals and initiatives in order to achieve a 100-percent clean-energy portfolio by 2050 (Murphy 2018). Improving the performance of existing highways is well-aligned with this initiative.

By filling the gap in research focused on  the entire life-cycle environmental impacts of pavement preservation treatments, the research offers important information for life-cycle assessment in future roadway projects. As transportation agencies look at how to manage their current assets, reduce costs, and avoid and minimize environmental impacts, pavement preservation offers a multitude of benefits to help achieve these goals.

Shown above is a Bergkamp M1, which can be used for slurry seal and microsurfacing. Source: By Eric Pulley – Own work, CC BY-SA 3.0, https://commons.wikimedia.org/w/index.php?curid=5176467

Citations:

Bates, Todd. “Keeping Roads in Good Shape Reduces Greenhouse Gas Emissions, Rutgers-Led Study Finds.” Rutgers Today. January 14, 2019. https://news.rutgers.edu/keeping-roads-good-shape-reduces-greenhouse-gas-emissions-rutgers-led-study-finds/20190114#.XH2SRYhKiUl.

BTS. “Road Condition.” Bureau of Transportation Statistics. June 2015. https://www.bts.gov/content/road-condition.

FHWA. “Long-Term Pavement Performance.” FHWA. 2019. https://highways.dot.gov/long-term-infrastructure-performance/ltpp/long-term-pavement-performance.

FHWA. “Pavement Preservation (When, Where, and How).” Center for Accelerating Innovation. May 30, 2018a. https://www.fhwa.dot.gov/innovation/everydaycounts/edc_4/pavement.cfm.

FHWA. “Specific Pavement Studies.” FHWA. March 12, 2018b. https://highways.dot.gov/long-term-pavement-performance/data-collection/specific-pavement-studies.

Murphy, Phil. “Murphy Administration Proposes Rules For State’s Re-Entry Into Regional Greenhouse Gas Initiative.” Office of the Governor. December 17, 2018. https://nj.gov/governor/news/news/562018/approved/20181217b.shtml.

Vitillo, Nicholas, and Hao Wang. “Appropriate Implementation of Pavement Preservation Treatments.” NJDOT. April 2015. https://www.state.nj.us/transportation/refdata/research/reports/FHWA-NJ-2015-011-I.pdf.

Wang, Hao, Israa Al-Saadi, Pan Lu, and Abbas Jasim. “Quantifying Greenhouse Gas Emission of Asphalt Pavement Preservation at Construction and Use Stages Using Life-cycle Assessment.” International Journal of Sustainable Transportation. January 11, 2019. https://www.tandfonline.com/doi/abs/10.1080/15568318.2018.1519086?journalCode=ujst20.

PMGA Divisions Take Lead on Extreme Weather, Climate Risks, and Asset Management

Introduction

In the summer of 2017, the Federal Highway Administration (FHWA), through a competitive application process, selected NJDOT as one of six (6) state DOTs to participate in a pilot program focused on extreme weather, climate risks and asset management. Each state is to prepare a case study that demonstrates how extreme weather and climate risks are integrated into asset management. FHWA intends to use the results of this effort to develop guidance materials to assist State DOTs in integrating extreme weather and climate risk into asset management practices, specifically in life cycle planning. Planning, Multimodal and Grant Administration’s (PMGA) Divisions of Environmental Resources and Statewide Planning have combined resources to undertake this endeavor that began in October 2017 and is to be completed by February 2019.

Extreme Weather Considerations Vary by State

The six (6) states selected for the Pilot program are Arizona, Kentucky, Massachusetts, Maryland, Texas and New Jersey, giving a diverse geographic perspective. Extreme weather involves different stressors dependent upon location. Whereas riverine flooding associated with heavy precipitation is the “extreme weather” condition that New Jersey and Texas have focused on, Maryland has focused on sea level rise and coastal flooding. Kentucky is focusing on both riverine flooding and other secondary extreme weather hazards from excessive rain such as landslides and sinkholes. Arizona has indicated that they often experience extreme weather in the form of excessive heat, wildfires and dust storms, as well as flash flooding from excessive rain. Finally, Massachusetts, also concerned with riverine flooding, is pursuing the development of a “stream power” tool to assist in assessing extreme weather impacts to their bridges and culverts.

New Jersey’s Approach

Case Study Area (Photo Credit: PMGA)

Originally selecting culverts as the “asset class” to investigate impacts of extreme weather, the New Jersey study has refocused more on identifying the root causes of flooding in specific areas to target cost-effective risk management and mitigation strategies. Using the Departments’ Drainage Management System (DMS) as the primary tool for identifying vulnerable areas subject to road closures due to severe precipitation such as flooding and/or icing, the study team has focused on two locations:

  • Portions of the I-80 corridor, milepost 56.43 – 58.22, ranked # 1 in 2016 DMS.
  • The intersecting Route 23 corridor milepost 4.00 – 7.00, ranked 14th on the 2016 DMS.

Culverts within these limits were identified as well as drainage systems, roadway conditions, topography, flood elevation mapping, and other pertinent data to fully understand the root causes of flooding at these vulnerable areas, and to see how projected climate changes could affect them. Once root causes are identified, then appropriate mitigation strategies can be developed to maintain a state of good repair in extreme weather conditions as best possible.

Communications: Key to Success

The ongoing study has seen early success by engaging internal and external stakeholders; promoting the need and value of cross communication among asset managers, engineers, planners, environmental and maintenance staff. Input from the “owners” of the Drainage Management System, Maintenance Management System, GIS, as well as designers for active projects in the study area from CPM all played key roles in providing critical information, assisting in developing findings for this effort. Maintenance crews have provided real time information related to recent extreme weather events, describing activities needed to further resiliency efforts in the study corridors. Finally, collaboration with NJTPA’s Passaic River Basin Resilience study has resulted in the sharing of critical flooding and climate forecasts to further assist in developing our Pilot Study. Together, the ongoing cross-communication has been the most valuable tool in developing this study, and has laid the groundwork for ongoing discussions on the subject of extreme weather, asset management, and transportation resilience.
Project Overview: Framework (Photo Credit: PMGA)

Early Findings

Addressing extreme weather and asset management cannot be handled in a broad sense as each asset has its own uniqueness in determining its sensitivity to extreme weather. Also, not all assets are vulnerable to projected climate forecasts. To truly address asset management and extreme weather, appropriate tools need to be developed, preferably in GIS format, to fully identify all assets that are vulnerable to extreme weather (excessive precipitation), then determine what mitigation strategies are needed to enable these assets to be resilient and maintain a state of good repair for New Jersey’s vast transportation network. Final recommendations on how to address extreme weather considerations in asset management will be a part of the final study and will serve as a starting point to address resiliency in the Department’s practices.

Contributed by Elkins Green

Featured image (top) is case study area #1: I-80 between M.P. 56.43 and M.P. 58.22. Photo Credit: NJDOT Aeronautics UAS Photo

This article first appeared in the December 2018 SCOOP, the employee newsletter of Planning, Multimodal and Grant Administration, “PMGA Divisions take lead on Extreme Weather, Climate Risks, and Asset Management: Quest for Resiliency.


New Jersey STIC Incentive Project Grant Funding Available

The FHWA offers technical assistance and funds—up to $100,000 per STIC per year—to support the costs of standardizing innovative practices in a state transportation agency or other public sector STIC stakeholder. NJDOT is the primary recipient of the STIC Incentive Grant. Other public sector STIC stakeholders such as MPOs, local governments or tribal governments are eligible to receive STIC Incentive funding as sub-recipients to the NJDOT.

The NJ STIC’s mission is to identify, evaluate, and where and when possible, rapidly deploy new technologies and process improvements that will accelerate project delivery and improve the quality of NJ’s transportation network. In recent years, STIC Incentive Funding Grants have been used in New Jersey to support innovation initiatives, including a Data Driven Safety Analysis; Implementation of a Connected Vehicles Pilot Program; and the Purchase, Use, and Evaluation of Unmanned Aerial Systems (UAS), among others.

The STIC Incentive Funding Project Grant proposal should include the following:

  • Description of the proposed work
  • End product/ result
  • Amount of STIC Incentive funding requested
  • Commitment of other funding
  • Budget justification
  • Project schedule

An initial deadline for submitting STIC Incentive Funding Grant proposals was set for February 1, 2019.  However, grant proposals will be reviewed on a rolling basis through the fiscal year provided funding is available. For more information on the STIC Incentive Funding Project Grant, please visit the following page: NJSTIC


The Use of Porous Concrete for Sidewalks

In December 2017, a team of researchers at the Center for Advanced Infrastructure and Transportation (CAIT) at Rutgers University published a research study for NJDOT on “The Use of Porous Concrete for Sidewalks.” A porous concrete sidewalk typically consists of a porous concrete slab on top of an open graded stone reservoir layer. A filter fabric is placed between the underlying soil and the reservoir layer. One of the most important benefits of porous concrete is its effectiveness for stormwater management, i.e. improving water runoff quality, reducing stormwater runoff, and restoring groundwater supplies. However, there are concerns related to its construction, cost, maintenance, and durability.

Rodding and finishing of a porous slab. Photo source: Najm, 2017.

The primary objective of the research study was to evaluate the various factors that influence the performance of porous concrete in sidewalks. These include hydraulic performance to meet New Jersey Department of Environmental Protection (NJDEP) regulations and structural performance to meet typical sidewalk strength requirements as well as life-cycle cost and maintenance requirements. The researchers compared the performance of porous concrete in sidewalks with other materials, such as conventional concrete and asphalt alternatives, and tested various pervious concrete mixes to evaluate the hydrological and structural performance and energy budget versus conventional concrete mixes. The team also conducted a cost benefit analysis for use of porous concrete on sidewalks versus alternatives. The study resulted in recommendations and guidelines that NJDOT could use to inform the mitigation of stormwater runoff and development of maintenance standards.

The study found that the effectiveness of porous concrete in reducing stormwater runoff could contribute to cost savings. The research report examined a number of important considerations affecting the broader implementation of this technology. A life-cycle cost analysis of three sidewalk design alternatives—porous concrete, porous asphalt, and conventional concrete—found that porous concrete had the highest initial construction cost, with conventional concrete coming in slightly less, and porous asphalt being the cheapest. The study showed that the service life of porous concrete may be shorter than conventional concrete, driving up the life-cycle cost and potentially offsetting the savings from stormwater management best practices. For porous asphalt, which has the shortest service life, findings showed that if the service life ratio of porous asphalt compared to conventional concrete was greater than 0.60, then porous asphalt would be the most economically competitive option of the three. Another consideration in some areas is that it may be less effective to implement porous pavement if the soil has low permeability. The report notes that, once implemented, periodic maintenance is required to prevent clogging from debris and sediments, and freezing in the winter to avoid failure due to freeze and thaw cycles.

Porous concrete beam during flexural test. Photo source: Najm, 2017

The research team recommended that next steps should include construction of a porous concrete sidewalk and a porous asphalt sidewalk for long- and short-term performance testing. They noted that implementation should include geotechnical evaluation of the subsoil layers for infiltration rates, hydraulic design and storm-runoff analysis, selection of porous mix design based on NJDOT specifications and contractor recommendations, sample prisms and cylinders extracted for lab tests, scheduled maintenance based on NJDEP and NJDOT guidelines, and regular inspection. While there are environmental benefits to the implementation, such as filtration of contaminants like metals, oils and grease, to improve water quality and reduce chloride pollution, there are also concerns it can cause groundwater contamination. These concerns, along with recommended further performance testing, highlight the importance of interim steps before wider implementation.

Pervious pavement is a key component of green infrastructure methods that seek to improve stormwater management. The New Jersey Department of Environmental Protection lists the practice among others such as rain barrels, cisterns, and rain gardens/bioretention basins as strategies that can be implemented on a variety of scales in order to both treat runoff and reduce runoff volume. Yet, as the report notes, there has been little published research on performance and practical experience in the United States, highlighting the researchers’ final recommendation for further testing.

Sources

Green Infrastructure in New Jersey. (2018). Retrieved from https://www.nj.gov/dep/gi/More_Info.html

Najm, H., Wang, H., Miskewitz, R., Roda, A. M., Ali, A., He, H., Chen, X., Hencken, J. (2017). The Use of Porous Concrete for Sidewalks. Retrieved from https://www.state.nj.us/transportation/refdata/research/reports/FHWA-NJ-2018-001.pdf

Najm, H., Wang, H., Miskewitz, R., Roda, A. M., Ali, A., He, H., Chen, X., Hencken, J. (2017). Technical Brief: The Use of Porous Concrete for Sidewalks. Retrieved from https://www.state.nj.us/transportation/refdata/research/reports/FHWA-NJ-2018-001-TB.pdf

New Jersey To Expand Data-Driven Approach to Highway Safety Management

NJDOT is investigating a powerful set of tools to more effectively manage New Jersey’s roads and highways. The agency has been piloting a study of Safety Analyst, a software package used by state and local highway agencies to identify highway safety improvement needs and projects for funding. The New Jersey State Transportation Innovation Council (STIC) applied Federal Highway Administration’s STIC Incentive Program funding to purchase the Safety Analyst license and service units from AASHTOWare. Following the kickoff and first year, NJDOT has continued to fund the project through FHWA’s Highway Safety Improvement Program (HSIP).

According to AASHTOWare, Safety Analyst helps agencies “proactively determine which sites have the highest potential for safety improvement, as opposed to reactive safety assessment done conventionally” (SafetyAnalyst.org). The software automates procedures and assists agencies to implement the six main steps of the highway safety management (HSM) process—network screening, diagnosis, countermeasure selection, economic appraisal, priority ranking, and countermeasure evaluation. Safety Analyst features four tool modules to perform the six HSM steps:

  • Module one utilizes the network screening tool and identifies sites with potential for safety improvement
  • Module two provides the diagnosis and countermeasure selection tool, which establishes the nature of accident patterns at specific sites
  • Module three includes the economic appraisal and priority ranking tool, which evaluates cost considerations of countermeasures for a specific site
  • Module four provides the countermeasure evaluation tool, which allows users to conduct before and after evaluations of implemented safety improvements

A detailed explanation of the benefits and capabilities of these four modules can be found in a series of white papers available from AASHTOWare.

NJDOT’s plans for using Safety Analyst

After receiving funds for Safety Analyst, NJDOT began a pilot study in Burlington County using the software. The objective of this study is to determine a methodology for meeting statewide goals. Items under review include implementation methodology (i.e., the manner and locations of data collection) and the resource requirements (i.e., the time, effort, and cost of implementing the software). NJDOT plans to use the software to more efficiently allocate its resources, time, and funds to improve the state’s roadways. Previously, NJDOT screened roads by identifying equivalent property damage, based on average frequency and severity of crashes and, depending on the project list, other factors such as annual average daily traffic and bicycle/pedestrian generators. Using Safety Analyst, NJDOT anticipates identifying needed road improvement more comprehensively using additional variables, such as roadway volume and characteristics, driveway density, and lane widths.

According to NJDOT Bureau of Transportation Data and Support’s Peter Brzostowski, who is working with the Bureau of Data and Safety, the agency is exploring other innovative ways to gather data for Safety Analyst. Leading ideas include:

  • Encouraging collaboration among several NJDOT Bureaus for data collection, including Traffic Engineering, Mobility and Systems Engineering, and Access Management
  • Employing monitoring systems to capture data, e.g., using existing/new cameras and radar monitoring
  • Utilizing Model Inventory of Roadway Elements (MIRE) (i.e., the FHWA Roadway Safety Data Program’s recommended list of roadway and traffic elements critical to safety management)
  • Developing official NJDOT policy for data collection standards
Who’s using Safety Analyst?

Motor traffic on Garden State Parkway, New Jersey, photographed in the evening. Most of the cars are southbound, moving from New York to the suburban homes in New Jersey.

State transportation departments and partner educational institutions can use Safety Analyst. At least eleven U.S. states have Safety Analyst licenses—Arizona, Illinois, Kansas, Kentucky, Michigan, Missouri, Nevada, New Hampshire, Ohio, Pennsylvania, and Washington, as well as Ontario, Canada. Some examples of its use include:

  • Ohio DOT employed their Safety Analyst model to develop the Access Ohio 2040 Long-Range Transportation Plan, which utilized crash data from the statewide AASHTOWare Safety Analyst model to predict the future safety impacts of alternative networks.
  • Michigan DOT is using Safety Analyst and GIS tools to develop a work-order-based maintenance management system and is exploring how to integrate new data collection tools, such as Light Detection and Ranging, or LIDAR, into its use of the software. See this MDOT case study for more information.
  • At least eight universities, including United Arab Emirates University, have educational licenses to use Safety Analyst.

The Safety Analyst software tool requires access to a minimum set of data elements including roadway segment characteristics, intersection characteristics, ramp characteristics, and crash data. Agencies or institutions that do not have the ability to collect the minimum data will not be able to utilize Safety Analyst.

According to AASTHOWare’s project manager, Vicki Schofield, the states that have been part of the Highway Safety Improvement System, a multi-state database that contains crash, roadway inventory, and traffic volume, typically have sufficient data resources to utilize the Safety Analyst software. She noted, however, that “all states should be using Safety Analyst or something as robust and researched.” She offered that Safety Analyst is an ideal tool to begin to evaluate the data, even if a state has not completely collected the system data.

How states can begin implementing SafetyAnalyst

Ms. Schofield explained that to implement Safety Analyst effectively, states should work in partnership with other state and federal agencies to assign roles and responsibilities and leverage expertise and capacity. For example, the state transportation planning office can be used to collect roadway and attribute data; the state enforcement office (i.e., Division of Highway Traffic Safety in New Jersey) to compile crash data; the state IT office to manage secure access to databases; and the FHWA division office to connect the state agencies with other resources.

With the Safety Analyst tool, a state will be able to efficiently perform highway safety management—a data-intensive and statistically complex process—to better predict long-term levels of safety at various locations. The tool supports more effective decision-making and provides justification for expenditures of Highway Safety Improvement Program funds, resulting in greater benefits for New Jersey residents and drivers from every dollar invested.

According to Ms. Schofield, the cost for purchasing the software is relatively minor and the primary barrier to implementing Safety Analyst is the time it takes to ready the data-intensive tool for use. Regional or local universities may be able to help expedite implementation by performing tasks that a transportation agency cannot and to help ensure integrity of the tool.

The NJDOT Bureau of Transportation and Support reports that work on the Safety Analyst Pilot Study is almost complete.  The Pilot Study is expected to provide information on areas that need to be addressed when developing a full scale contract for the implementation and development of Safety Analyst on a statewide level.  The goal will be to maximize the benefit of Safety Analyst to NJDOT and to provide the necessary structure for a sustainable future for the program.

Sources

AASHTOWare. 2010. SafetyAnalyst: Software Tools for Safety Management of Specific Highway Sites:

Brzostowski, P. 2017. AASHTOWare Safety Analyst. Presentation to the New Jersey State Transportation Innovation Council. Winter Meeting.

Harwood, D. W., Torbic, D. J., Richard, K. R., & Meyer, M. M. 2010. SafetyAnalystTM: Software Tools for Safety Management of Specific Highway Sites. FHWA-HRT-10-063. Turner-Fairbank Highway Research Center.

LiSanti, D., and C. Trueman. 2018. CIA Safety Team. Presentation to New Jersey State Transportation Innovation Council. Summer Meeting.

LiSanti, D., and K. Skilton. 2018. CIA Safety Team. Presentation to New Jersey State Transportation Innovation Council. Fall Meeting.

NJDOT Awarded Accelerated Innovation Deployment Grant to Start Weather-Savvy Roads Pilot Program

The Federal Highway Administration has awarded NJDOT a $322,461 Accelerated Innovation Deployment (AID) Demonstration grant to “start a ‘weather-savvy roads’ pilot program to improve roadway safety and operational efficiency.”

Preliminary plans include equipping up to 20 NJDOT road maintenance vehicles with dash-mounted cameras and weather sensors, which will feed real-time data directly to NJDOT year-round. The data will support improved awareness of road conditions and faster response times during weather events.[1] New Jersey’s winter season includes frequent precipitation, making for slick road conditions and added congestion. The data retrieved from the cameras and sensors will help quicken operations and also enhance deployment of incident management strategies.

This is the first AID grant applied for through New Jersey’s State Transportation Innovation Council (STIC). This year, FHWA awarded $8.4 million to nine states for work on innovative highway and bridge projects to improve safety and operational efficiency.

Importance of Weather-Responsive Management Strategies

Weather effects on our nation’s roads have enormous social and economic costs. According to the FHWA, 1.2 million (or 21 percent) of the more than 5.7 million vehicle crashes over the past 10 years were weather-related. Nearly 6,000 people are killed and over 445,000 are injured in weather-related crashes each year. In terms of mobility, the weather is responsible for 25 percent of non-recurring delays as well as congestion costs of up to $9.5 billion per year for 85 urban areas[2] and $3.4 billion in freight costs.

To address these problems, states can implement weather-responsive management strategies, which have many benefits including reducing crash risks and delays, lowering negative environmental impacts by minimizing road salt use, and enabling travelers to make better driving decisions.

In recent years, the FHWA Road Weather Management Program has focused on using mobile observations and connected vehicle data to support traffic and maintenance management. States such as Nevada, Michigan, and Minnesota have already implemented winter maintenance/anti-icing strategies using “Integrating Mobile Observations” (IMO), which involves collecting weather and road condition data from government fleet vehicles. Pathfinder, another solution, is a collaborative strategy across state DOTs to disseminate road weather information for proactive transportation system management ahead of, and during, adverse weather events.

Every Day Counts and State Transportation Innovation Councils

The AID program works closely with the FHWA Every Day Counts (EDC) program to foster a culture of innovation. Every two years, FHWA works with state DOTs and other public and private stakeholders to identify new sets of innovative technologies that merit widespread deployment to address transportation challenges. State Transportation Innovation Councils (STICs) from all fifty states then meet to evaluate these innovations and lead deployment efforts.

Weather management was named a priority in recent years. In 2017-2018 the fourth round of EDC (EDC-4) cited11 innovations including “Road Weather Management – Weather-Savvy Roads.” In 2018-2019, EDC-5 identified 10 innovations including “Weather-Responsive Management Strategies.

See the FHWA’s Innovation Spotlight video on Road Weather Management: Weather Savvy Roads.

Weigh-in-Motion Sites Collect Vehicular Data

The NJDOT Bureau of Transportation Data and Safety (BTDS) is responsible for administering the Federal Highway Administration’s (FHWA) mandated annual Highway Performance Monitoring System (HPMS) reporting. The Traffic and Technology Section (TTS) of the BTDS supports the HPMS reporting by administering a Traffic Monitoring Program that includes a combination of continuous and short-term traffic data collection efforts. In addition to the approximately 150 state-wide continuous count sites, the TTS also uses consultants to count in excess of 1,800 short-term sites per year and 650 ramp sites per year.

Typical WIM installed on a Roadway in New Jersey (Photo Credit: BTDS Contractor)

The continuous count program includes the data downloading, data processing, and routine maintenance of the Weigh-in-Motion (WIM) and Traffic Volume Station (TVS) sites. The WIM and TVS sites in New Jersey are located on various types of roadway classifications ranging from Urban Interstates to Rural County Roads. WIM sites collect vehicular data such as volume, classification, weight, and speed. TVS sites collect volume data only. Both types of site’s data are reported to FHWA and can be located on the NJDOT website.

Through the Innovative Concepts portion of the Traffic Monitoring Program contract, the TTS worked hand-in-hand with a consultant to develop an interactive website solely dedicated to NJDOT WIM information. This website enables any user to view New Jersey WIM statistics graphically, as well as having the ability to download data to fit their needs or requests. Users can see statistics such as overall volumes for the state by Class, entering/exiting volumes at WIM sites near New Jersey borders, and traffic information by lane and by hour for a specific WIM site just to name a few.

Currently, the TTS is responsible for 95 WIM sites state-wide. Although the latest historical data is available through an interactive map located on the NJDOT website, it is cluttered with the entire Traffic Monitoring Program Counts and only shows the latest couple years of data for any WIM site. In addition, any request for specific WIM data from the public or within NJDOT would have to be processed by in-house TTS staff.

The New Jersey WIM website was just recently launched and can be found on the NJDOT website. Early feedback has been extremely positive and has allowed TTS staff to drastically reduce the data processing task for recent requests by directing requestors to the website. Additionally, it enables the TTS data publication to reach a wider and more diverse audience.

Contributed by Eric Oberle

Featured image (top) is a typical WIM installed on a Roadway in New Jersey. Photo Credit: BTDS Contractor

This article first appeared in the June 2018 CIPGA SCOOP, the employee newsletter of Planning, Multimodal and Grant Administration.

New Jersey Pilots Connected Vehicles Program to Protect Safety Service Patrol Staff

NJDOT safety service patrol vehicle. Source: NJDOT

Each day New Jersey’s safety service patrol (SSP) workers put their own safety at risk to assist motorists in need and to assist other first responders. In addition to warning other motorists about recent traffic incidents, they remove disabled vehicles, provide gasoline, and perform vehicle repairs. Safety service patrol workers use temporary signage, traffic cones, flares, and portable variable message signs (PVMS), existing overhead message signs, the NJ511 phone and website systems as well as the SafeTrip application to warn motorists about their presence.

Unfortunately, collisions involving safety service patrol workers still occur. Cars often travel at excessive speeds near staff who work on the scene of such collisions. In 2015, the Federal Highway Administration (FHWA) reports that a work zone crash occurred once every 5.4 minutes in the United States. The impact of crashes can be catastrophic. Every day 70 work zone crashes occurred that resulted in at least one injury, while every week 12 work zone crashes occurred that resulted in at least one fatality. The NJDOT’s continued efforts to reduce work zone fatalities since the 1990s has resulted in one of the lowest rates in the nation. Despite this, at least one service worker has died in a New Jersey work zone each year since 2007. In 2016 seven fatal crashes occurred in New Jersey work zones, including the death of one service worker.

The automobile manufacturing industry is in the technology development phase of putting connected and automated systems fully in place.  Once deployed, first responders and/or their response vehicles would be detected by these systems to prevent crashes resulting from oncoming traffic.  Until those systems are deployed, the most used applications to alert motorists to roadside incidents, stopped police vehicles and other types of hazards is by Google, Waze, or HERE.

To help ensure the safety of service patrol staff, NJDOT has initiated a pilot study that will examine the effectiveness of using connected vehicle technology to alert the motoring public to the presence of safety service workers at an incident site. Starting in September 2018 NJDOT will pilot the use of a Beacon Hazard Lights technology to alert drivers to the presence of workers when safety service vehicles turn on their hazard lights. The piloting of the technology has received the support of the NJ State Innovation Council and a State Innovation Council Incentive Funding grant of $39,600 awarded by FHWA.  More information about the STIC Incentive Funding source can be found here.

According to Ross Scheckler, the managing partner of iCone, the product supplier for the hazard light technology to be piloted in the NJ study, the firm seeks to build technologies that will increase the availability of data about work zones to the traveling public.  Their tools alert drivers in real-time to the presence of workers, lane-closures and construction related back-ups by making them available on the cloud, where state traffic centers and navigations companies like HERE and Waze can pick them up.  A primary goal of the technology is to let drivers of vehicles know that the rescue truck or the flagger is in the road miles ahead so that the driver or the automation system can slow down and move over, or maybe choose a different route.

In the New Jersey pilot program, the iCone technology will transmit the location of worker vehicles within two minutes of the activation of a vehicle’s hazard lights. The location updates every 15 minutes and is re-transmitted if the vehicle moves more than 500 feet.

Data from 31 SSP vehicles will alert drivers via 511NJ as well as mapping & traffic apps

Thirty-one Safety Service Patrol (SSP) vehicles in Harding and Cherry Hill Yards will pilot iCone’s GPS technology to alert drivers using the 511NJ website and mapping, and traffic apps including Google Maps, Waze, and Here.  A Texas DOT study found that deploying iCone’s traffic beacons reduced crashes at a busy highway up to 45 percent (WorkZoneSafety.org). In addition, beacons deployed on roads resulted in crash cost reductions between $6,600 and $10,000 per night. Arlington is one of more than 450 partners including city, state and country government agencies, nonprofits and first responders to partner with the Waze Connected Citizen Partner program, a free data-share of publicly available traffic data, to deliver road and construction work information to cars.

Different states have used iCone’s technology in various ways, according to Mr. Sheckler. For example, Nevada has focused on relaying lane closures through iCone’s “Smart Arrow Board” modification product. Colorado on the other hand, has focused on the location of traffic cones around work zones through the ‘iPin’ product.  New Jersey’s initiative will examine the effectiveness of iCone’s technology on service patrol vehicles.

One benefit of the approach being tested is that the data appears to be comparatively low-cost and effective in reaching the traveling public through available traffic flow applications.  Mr. Scheckler, iCone’s product supplier representative, notes that most states can quickly accommodate to the data flow that the firm produces since the data feed is modeled off the Waze format.  “When states aren’t ready to integrate the data flow, the data still goes out to millions of cars through partners like Waze, HERE and Panasonic. This works so well that in states that haven’t started picking up the feed, we still have contractors using our equipment because they want their workers to show up in the car.”

iCone’s Vehicle Hazard Light Radio Adaptation GPS device. Source: iCone

In New Jersey, one of the program’s goals is to enhance awareness of the State’s Move Over Law enacted in 2009. The law requires a driver who sees an emergency safety vehicle to approach cautiously and, if possible, make a lane change into a lane not adjacent to the emergency vehicle. Emergency safety vehicles include those operated by fire or police departments, ambulance services, tow trucks and highway maintenance or emergency service vehicles, many of which display flashing yellow, amber or red lights. Drivers must create an empty lane of traffic or prepare to stop, if possible, or face fines of no less than $100 and a much as $500.

NJDOT plans to evaluate the success of the program during Year 1 and determine interest and opportunities for collaboration with transportation agencies in other states and first responder organizations. NJDOT is part of TRANSCOM (XCM), a coalition of 16 transportation and public safety agencies that improves communication and technology by the use of traffic and transportation management systems and in partnership with technology companies. XCM currently provides NJDOT incident data to Google, Waze, and Here as well as the 511NJ web and phone platform, however SSP vehicle location data is not integrated into any of these programs.

Sources:

Cowan, S. (2018). Spring 2018 STIC presentation: Connected Vehicle — Road Service Safety Messages. Retrieved from: https://www.njdottechtransfer.net/wp-content/uploads/2018/04/CIA-Team.pdf

Hsieh, E. Y., Ullman, G. L., Pesti, G., & Brydia, R. E. (2017). Effectiveness of End-of-Queue Warning Systems and Portable Rumble Strips on Lane Closure Crashes. Journal of Transportation Engineering, Part A: Systems, 143(11), 04017053. Retrieved from:  https://ascelibrary.org/doi/abs/10.1061/JTEPBS.0000084

National Work Zone Safety Information Clearinghouse. (c2016). 2016 New Jersey Work Zone Fatal Crashes and Fatalities. Retrieved from https://www.workzonesafety.org/crash-information/work-zone-fatal-crashes-fatalities/#new%20jersey

Ullman, G. L., Iragavarapu, V., & Brydia, R. E. (2016). Safety effects of portable end-of-queue warning system deployments at Texas work zones. Transportation Research Record: Journal of the Transportation Research Board, (2555), 46-52. Retrieved from https://doi.org/10.3141/2555-06

FHWA Announces EDC-5 Innovation Areas

The Every Day Counts Program (EDC) is a state-based model that identifies and rapidly deploys proven, yet underutilized innovations to shorten the project delivery process, enhance roadway safety, reduce traffic congestion, and improve environmental sustainability. Proven innovations promoted through EDC facilitate greater efficiency at the state and local levels, saving time, money and resources that can be used to deliver more projects.

FHWA works with state transportation departments, local governments, tribes, private industry and other stakeholders to identify a new collection of innovations to champion every two years that merit accelerated deployment.  FHWA’s Center for Accelerated Innovation (CAI)  fosters collaboration between stakeholders within the transportation community through the State Transportation Innovation Councils (STIC) network. The STIC is a national network that brings together public and private transportation stakeholders to evaluate innovations and spearhead their deployment in each state.

After conducting outreach among the state stakeholders, the FHWA’s CAI has recently issued EDC-5 Innovations, the next round of areas of innovation.  Transportation leaders and front-line professionals from across the country will gather at one of the 5 Regional Summits taking place in the fall of 2018 to discuss and identify opportunities implementing the innovations that best fit the needs of their respective state transportation program. NJDOT’s team will attend the Regional Summit in Albany, New York.  Following the summits, New Jersey will be among the states that will finalize their selection of innovations, establish performance goals for the level of implementation and adoption over the upcoming two-year cycle, and begin to implement the innovations with the support and assistance of the technical teams established for each innovation.  Further information about each of the EDC-5 Innovations are described below

Advanced Geotechnical Exploration Methods.  Conventional subsurface exploration methods provide limited data for project design, which can result in constructability issues and increased cost. Advanced geotechnical exploration methods offer solutions for generating more accurate geotechnical characterizations that improve design and construction, leading to shorter project delivery times and reducing the risks associated with limited data on subsurface site conditions.

Collaborative Hydraulics: Advancing to the Next Generation of Engineering (CHANGE). Advances in hydraulic modeling tools are providing a more comprehensive understanding of complex flow patterns at river crossings versus traditional modeling techniques. These 2D hydraulic modeling and 3D computer visualization technologies also facilitate more effective communication and collaboration, improving agencies’ ability to design safer and more cost-effective and resilient structures on waterways.

Project Bundling. Many states continue to see an increase in the number of highways and bridges needing attention, and those that are posted for reduced loads adversely affect travel, freight movement, and emergency response times. Project bundling helps address this national issue. By awarding a single contract for several similar preservation, rehabilitation, or replacement projects, agencies can streamline design and construction, reduce costs, and effectively decrease transportation project backlogs.

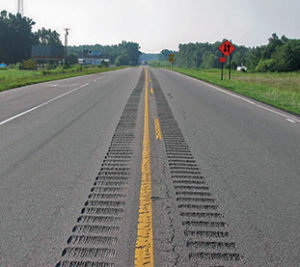
Reducing Rural Roadway Departures. Reducing fatalities on rural roads remains a major challenge in the United States. Roadway departures on the rural road network account for one-third of traffic fatalities. Systemic application of proven roadway departure countermeasures, such as rumble strips, friction treatments, and clear zones, helps keep vehicles in their travel lanes, reduce the potential for crashes, and reduce the severity of those crashes that do occur.

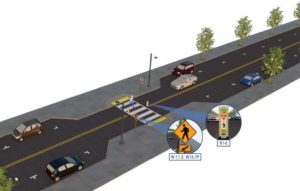
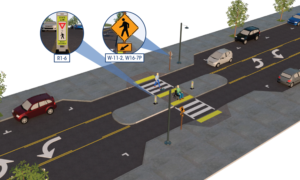
Safe Transportation for Every Pedestrian (STEP). Pedestrians accounted for 16 percent of all roadway fatalities, and crashes are predominantly at midblock and intersection crossing locations. As pedestrian safety continues to be a concern for transportation agencies across the country, cost-effective countermeasures are available to assist practitioners in providing safer crossings for all pedestrians.

Unmanned Aerial Systems (UAS). UAS can benefit nearly all aspects of highway transportation, from inspection to construction and operations, by collecting high-quality data automatically or remotely. These relatively low-cost devices allow agencies to expedite the data collection needed for better-informed decisions while reducing the adverse impacts of temporary work zones on work crews and the traveling public.

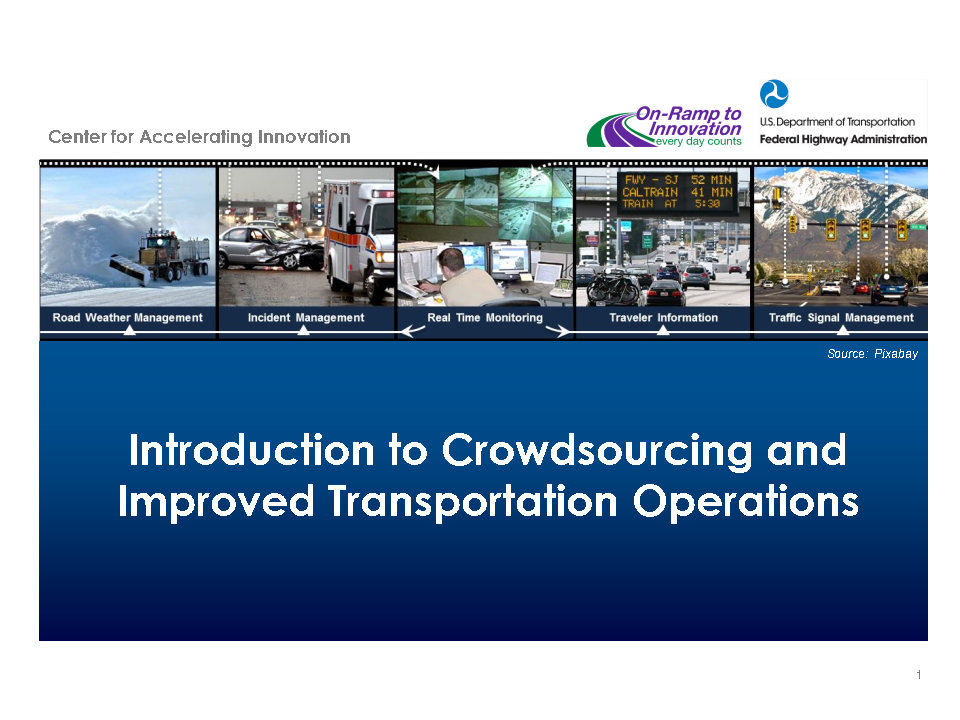
Use of Crowdsourcing to Advance Operations. State DOTs and local agencies traditionally rely on data from fixed sensors and cameras that monitor single locations to operate and manage their transportation systems. Using new sources of crowdsourced traffic data, agencies have access to large amounts of reliable, real-time data with more geographic coverage of the transportation system than with traditional sources. Combining crowdsourced data with traditional data sources enables better management and operation of the transportation system through faster detection of and response to problems, faster and more accurate traveler information to the public, and more proactive and effective operations strategies.

Value Capture: Capitalizing on the Value Created by Transportation. When public agencies invest in transportation assets that improve access and increase opportunity in the community, adjacent property owners benefit through greater land value and other economic impacts. Many techniques are available to the public sector to share in a portion of this increased land value to build, maintain, or reinvest in the transportation system.

Virtual Public Involvement. Robust public engagement during transportation planning and project development can accelerate project delivery by identifying issues and concerns early in the process. Virtual public involvement techniques, such as telephone town halls and online meetings, offer convenient, efficient, and low-cost methods for informing the public, encouraging their participation, and receiving their input.

Weather-Responsive Management Strategies. More than 20 percent of crashes are weather-related, and weather-associated delays can result in significant losses in productivity and efficiency. Weather-responsive traffic and maintenance management strategies support state and local transportation agencies in deploying improved traffic control and traveler information systems that will significantly reduce highway crashes and delays resulting from adverse weather. It also promotes anti-icing strategies for reducing chloride use.