


Evaluating New Jersey’s Use of Raised Pavement Markers for Roadway Safety
In the United States, data has shown that more than a third of fatal crashes on two-lane undivided highways and 27 percent of fatal crashes on four-lane divided highways occur in dark, unlighted conditions. Raised Pavement Markers (RPMs) are a common device deployed...
New Protocol for Accepting Over-Coating Paint on Steel
The Research Advisory Committee of the American Association of State Highway and Transportation Officials (AASHTO) selected an NJDOT project as one of 16 high-value research projects for 2019 in the category of Smart Maintenance and Preservation. Researchers from...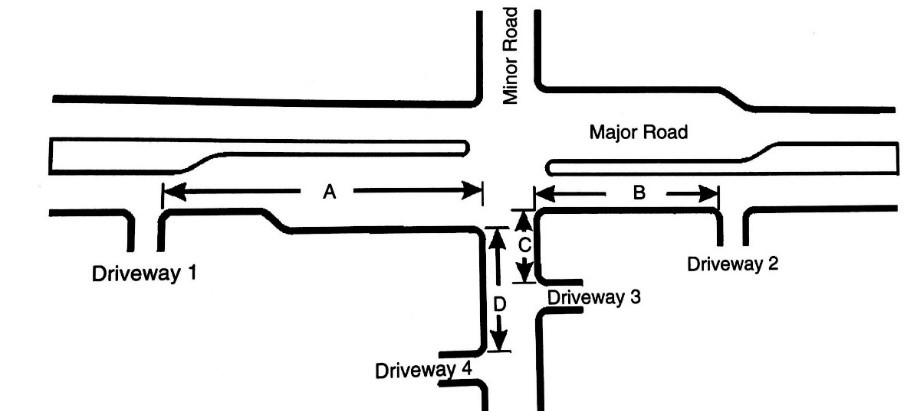
Local Access Management Regulations
The New Jersey Department of Transportation (NJDOT) is responsible for administering an access management policy for the state highway system. The Federal Highway Administration (FHWA) defines access management as “the proactive management of vehicular access points...
The Use of Porous Concrete for Sidewalks
In December 2017, a team of researchers at the Center for Advanced Infrastructure and Transportation (CAIT) at Rutgers University published a research study for NJDOT on “The Use of Porous Concrete for Sidewalks.” A porous concrete sidewalk typically consists of a...
Identifying High Risk Bridges in New Jersey
A team of researchers from New Jersey Institute of Technology have improved upon methods to identify high risk bridges in New Jersey to facilitate prioritization for repair or replacement. They have accomplished this through validating and advancing a new...
 |