The previous article in this two-part series addressed the ways that state DOTs have been innovating to reduce Greenhouse gas (GHG) emissions, as a means of slowing climate change. However, an already changing climate is bringing more severe and unprecedented weather, challenging the durability of the nation’s infrastructure.
Resiliency is defined by the State of New Jersey as “as the ability of social and ecological systems to absorb and adapt to shocks and stresses resulting from a changing climate, while becoming better positioned to respond in the future.” Many state DOTS are rising to this challenge, innovating through adoption of planning, technological, and engineering methods to protect roads, bridges and the people that use them.
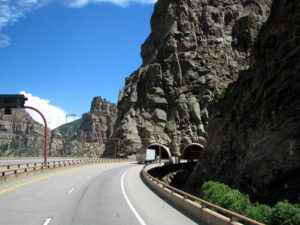
In Colorado, an example of climate change-exacerbated weather affecting a vital interstate link illustrates both the growing threat and the potential for action. Between the municipalities of Dotsero and Glenwood Springs, Interstate 70 travels through the Rocky Mountains (Fig. 1), following a narrow canyon bed alongside the Colorado River. In early fall 2020, the Grizzly Creek Fire burned through 32,631 acres, including the elevated terrain above I-70. Then, in summer 2021, an atypically high rainfall event created a large mudslide that poured onto the highway, bringing traffic to a halt and trapping some motorists in the nearby Hanging Lake Tunnels. But, had thorough resiliency planning not been conducted after a devastating 2013 rockslide in the same vicinity, further destruction would have been assured. Instead, a berm built in 2020 diverted 100,000 cubic yards of debris away from the tunnels (and a Colorado Department of Transportation (CDOT) Command Center), saving lives and hundreds of millions of dollars in the process. According to CDOT’s director of maintenance and operations, the berm improvement cost less than $50,000.
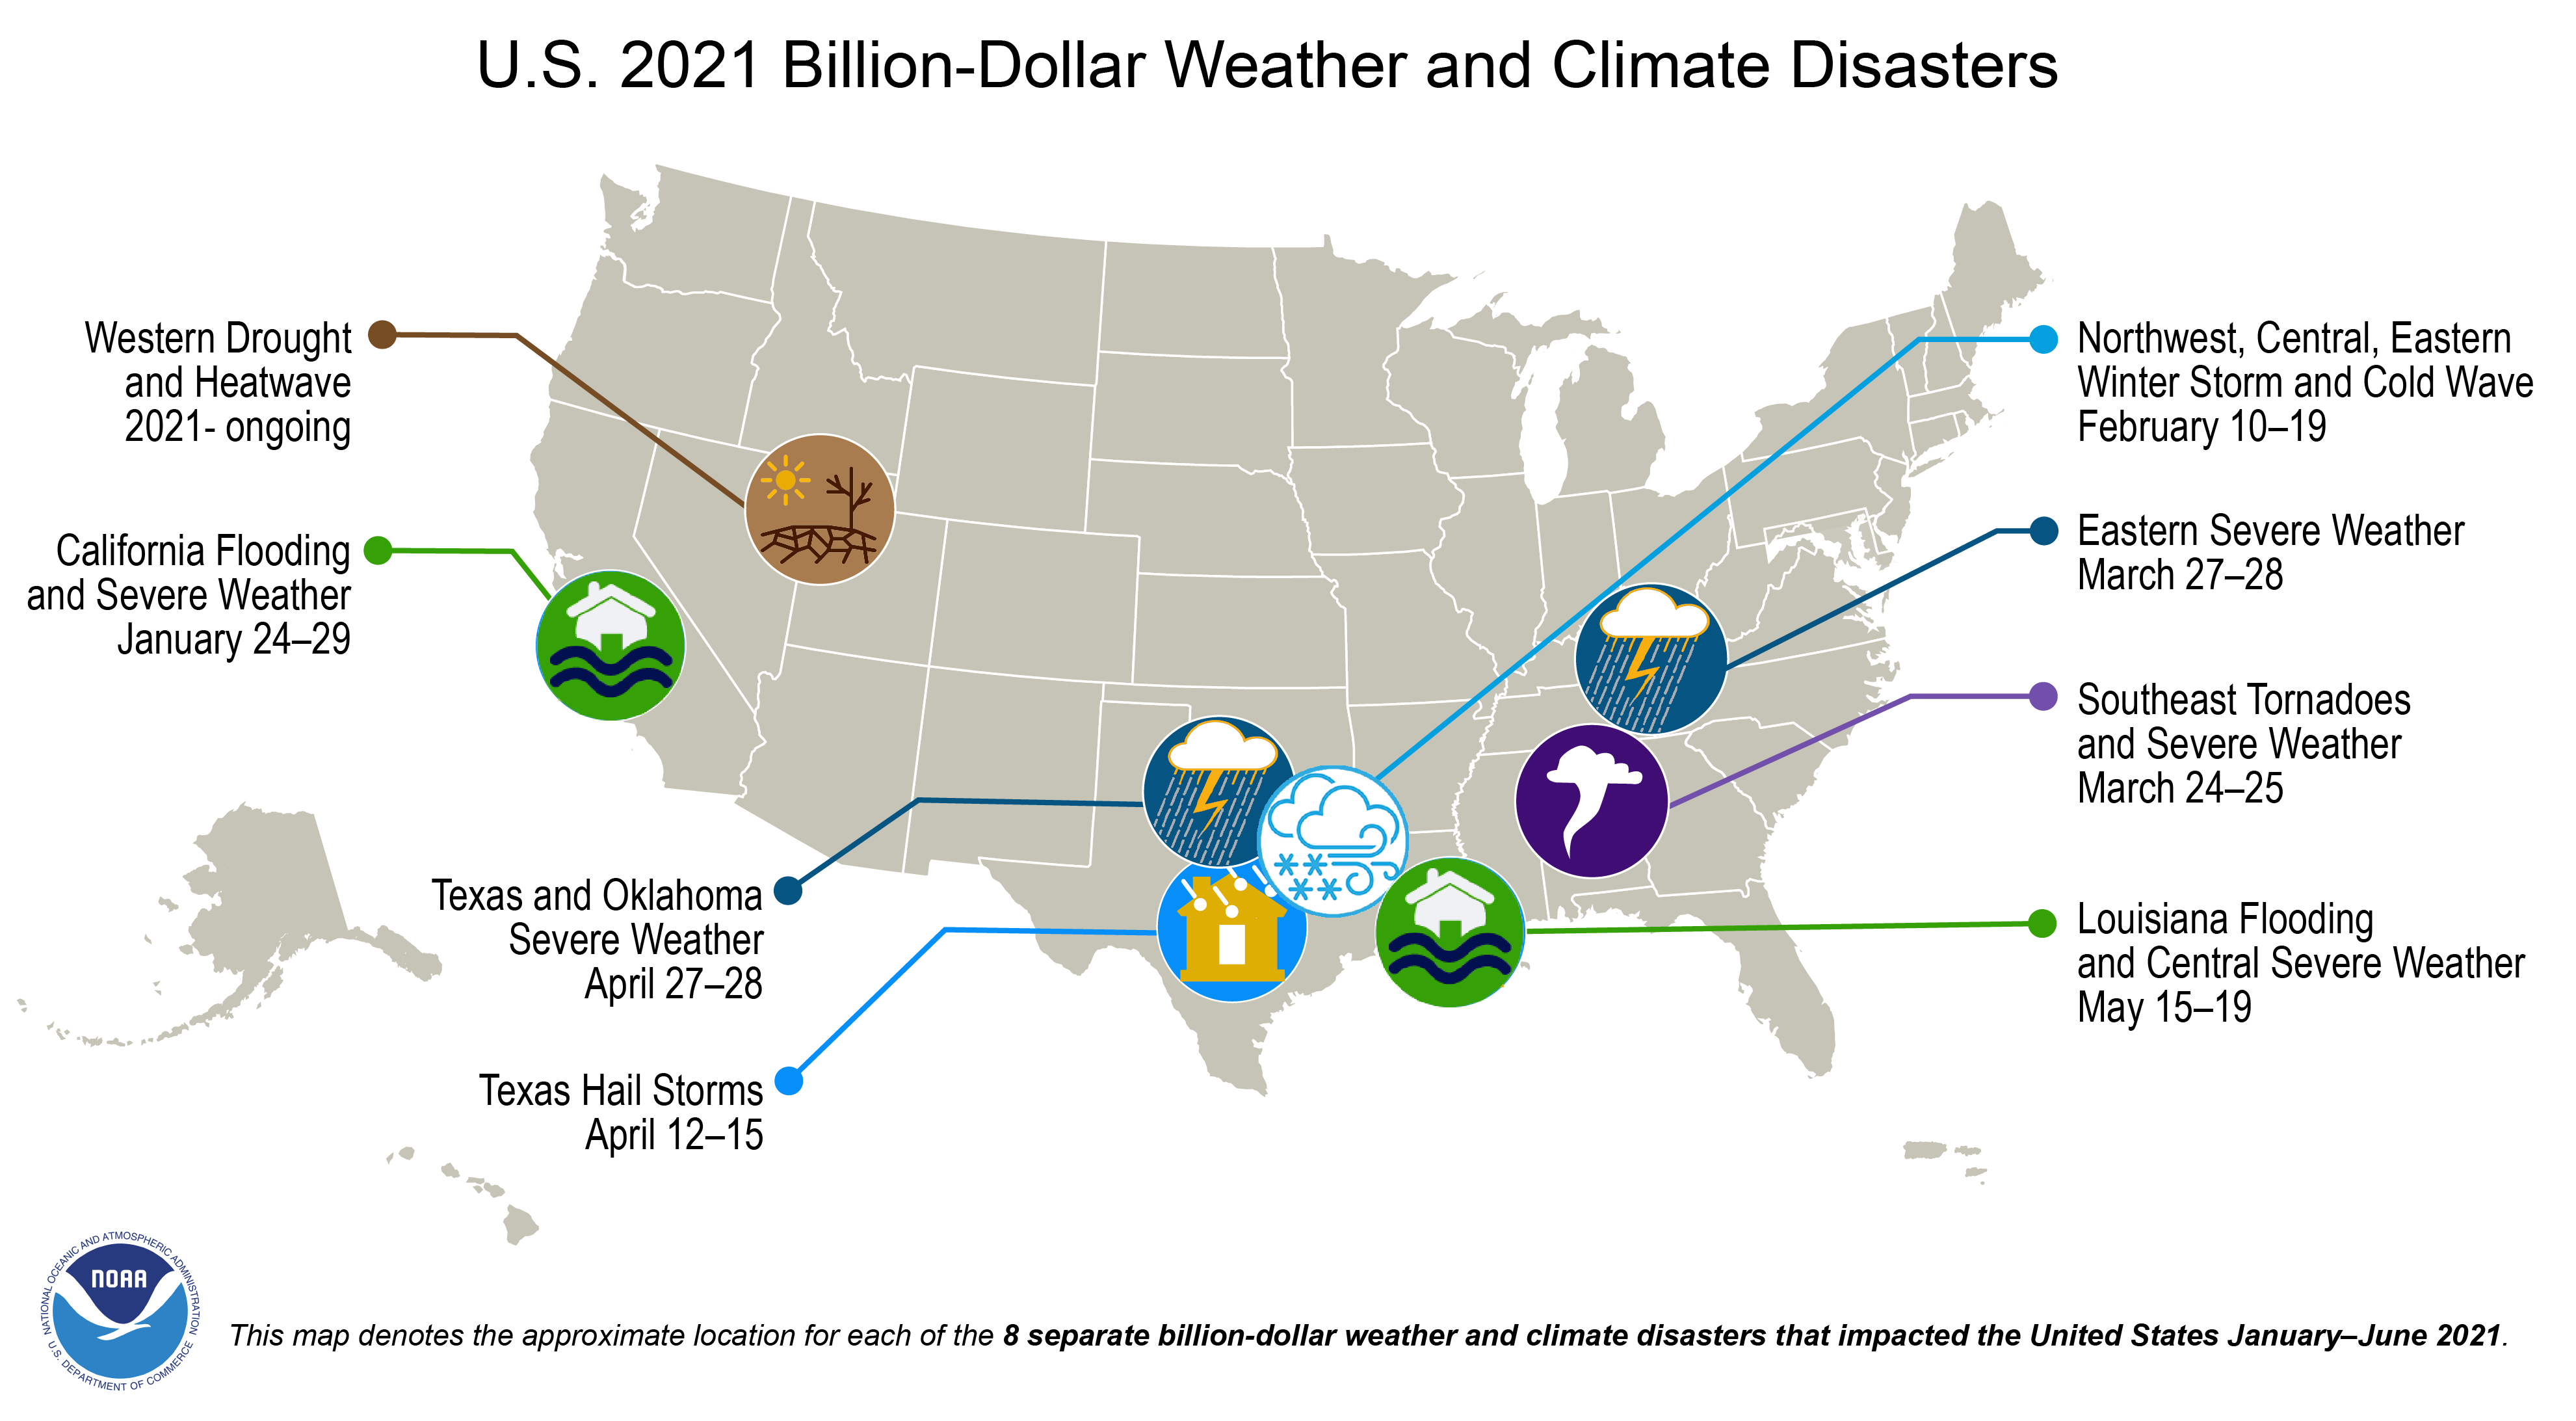
This dramatic case study demonstrates the value of risk and resilience planning for a state roadway network. But Colorado, of course, is not on its own. According to the National Oceanic and Atmospheric Administration (NOAA), billion-dollar climate-borne disasters have been steadily increasing since the agency began tracking them in 1980 (Fig. 2). In particular, our transportation infrastructure, vital for so many economic and societal functions, is challenged by increasingly frequent and severe weather events. While different geographies present different threats, there is a common need for threat assessment and decision-making frameworks to strategically build infrastructure resilience. There is much opportunity to innovate with new technologies, engineering methods, and planning frameworks for the purpose of strengthening our transportation network.
Table 1. A Brief Scan of Resiliency Planning Initiatives
| State | Theme | Action |
|---|---|---|
| California | Assessment - Comprehensive | Five-tier adaptation report for each district |
| California | Assessment - Sea Level Rise | Pilot sea-level rise assessment in San Francisco Bay Area |
| Colorado | Assessment - Comprehensive | Risk and Resilience Analysis Procedure |
| FHWA | Assessment - Comprehensive | Vulnerability Assessment and Adaptation Framework, 3rd Edition |
| Florida | Assessment - Sea Level Rise | Sea Level Scenario Sketch Planning Tool |
| Hawaii | Assessment - Comprehensive | Action plan that identifies risky areas and strategies for incorporating resilience |
| Illinois | Assessment - Comprehensive | Risk analysis, now developing processes to implement resilience |
| Iowa | Assessment - Flooding | Resiliency and vulnerability assessment for I-380 |
| New Jersey | Assessment - Flooding | Flood Risk Mapping Project |
| Texas | Assessment - Comprehensive | Climate Change/Extreme Weather Vulnerability and Risk Assessment for Transportation Infrastructure in Dallas and Tarrant Counties |
| Vermont | Assessment - Flooding | Tool for identifying risk levels for roads, bridges and culverts |
| Washington | Assessment - Comprehensive | Statewide climate analysis of vulnerable agency-owned infrastructure |
| Washington | Assessment - Flooding | Skagit County targeted assessment of flood risk |
FHWA & NCHRP Research Frameworks
In 2012, the Moving Ahead for Progress in the 21st Century Act (MAP-21) called for each state to create “a risk-based asset management plan for the National Highway System to improve or preserve the condition of the assets and the performance of the system” (MAP-21, 2012). The FHWA resource, Vulnerability Assessment and Adaptation Framework, 3rd Edition (2017), seeks to combine the legislatively-mandated work of risk assessment with the rising threat of climate change upon the system.
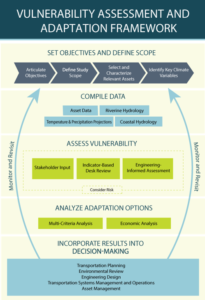
The Framework shares examples of approaches for each step in the vulnerability assessment and adaptation framework (see Fig. 3). For example, for the first step, “Articulate objectives and define study scope,” the report gives instances of the North Central Texas Council of Governments’ vulnerability assessment work, the San Francisco Bay Area’s Metropolitan Transportation Commission’s (MTC) ongoing efforts to model and react to sea level rise and storm surge, as well as the Iowa Department of Transportation’s and Massachusetts Department of Transportation’s respective inquiries into how increased flooding would affect critical infrastructure. For state DOTs looking for a rich bibliography of vulnerability assessment resources and case studies, the FHWA Framework’s Appendix A includes resources for selecting climate variables, projecting temperature and precipitation, obtaining sea level rise information, and determining how to incorporate results of assessments into the transportation planning process, among others.
The National Highway Cooperative Research Program (NCHRP), an initiative supported by the American Association of State Highway and Transportation Officials (AASHTO), working in cooperation with FHWA, has been researching resilience planning for state DOTs, with several ongoing projects. A brief scan of recent work finds a variety of other resiliency initiatives undertaken by state DOTs in roadway engineering, planning, and operations, with several reports reiterating that there remains work to be done.
The program’s 2019 Applying Climate Change Information to Hydrologic and Coastal Design of Transportation Infrastructure addresses how to plan and engineer hydrologic and coastal infrastructure for a changing climate. Typically, engineers use historical assumptions to predict future conditions, but, in a changing climate, this approach is problematic. The guide provides two different decision-making frameworks, Top-Down and Threshold (Bottom-Up), as well as probabilistic risk assessments to best understand the appropriate course of action, such as whether to significantly invest in making a facility more resilient.
A report published by NCHRP the previous year, Resilience in Transportation, Planning, Engineering, Management, Policy, and Administration (2018), works to synthesize the state of the practice. The survey of 40 state DOTs revealed a pressing need for resilience metrics and assessment methods. According to the study, “Currently there is no standard measurement for resilience within highway analysis.” However, in the intervening years, many state DOTs have begun the work of developing risk assessments and resiliency plans.
NCHRP’s Incorporating the Costs and Benefits of Adaptation Measures in Preparation for Extreme Weather Events and Climate Change Guidebook (2020) describes technical steps to assist agencies in conducting CBAs (Cost-Benefit Analyses) for climate resilience. With sample scenarios and problems, the resource explains the necessity for CBAs as a resilience decision-making tool, and the various considerations that must be taken into account. Later, this article will touch upon how CDOT used CBAs for its risk assessments and resiliency planning.
Finally, NCHRP’s Transportation System Resilience: Research Roadmap and White Papers (2021) identifies several pressing research needs for the current five-year period. After synthesizing reports, and conducting workshops and outreach, consultants created a ranked list of projects; notably, the first two of these projects were Integrating Resilience into Transportation Project Development and Economic Benefits from Making Investments in Resilient Transportation Assets. The report calls for continued, balanced research into many topics to build the most system resilience, cautioning that: “Disruptive forces have no end point but continue and may, in fact, worsen over time. Recovery is not an option – the best that can be hoped for is continuous adaptation.”
Analyzing and Prioritizing Vulnerable Assets

A handful of geographically diverse state DOTs provide insightful examples of the present state of resiliency planning. Due to federal requirements, DOTs have conducted in-depth inventories of state roadway networks, categorizing them by vulnerability and level of risk. The handful of examples that follow show how different jurisdictions and geographies have approached this work to understand how environmental shifts are anticipated to affect infrastructure, and to prioritize facilities by their significance to the overall transportation network.
In California, Caltrans has compiled adaptation priority reports for each district. For District 4, which encompasses the Bay Area region, Caltrans and consultants assigned an Average Cross-Hazard Prioritization Score to each exposed bridge, culvert, and roadway asset. A score for each asset was calculated using context-sensitive criteria—for instance, temperature affects the integrity of asphalt binders more significantly than it would a culvert. On the Priority 1 Tier are major, threatened pieces of infrastructure, such as the Golden Gate Bridge, a large culvert over the Transmission Canal, and many segments of coastal roadway around the San Francisco Bay. According to the document, the next steps will be to prepare more detailed adaptation assessments for these assets, as well as to integrate these prioritization measures into the district’s asset management system.
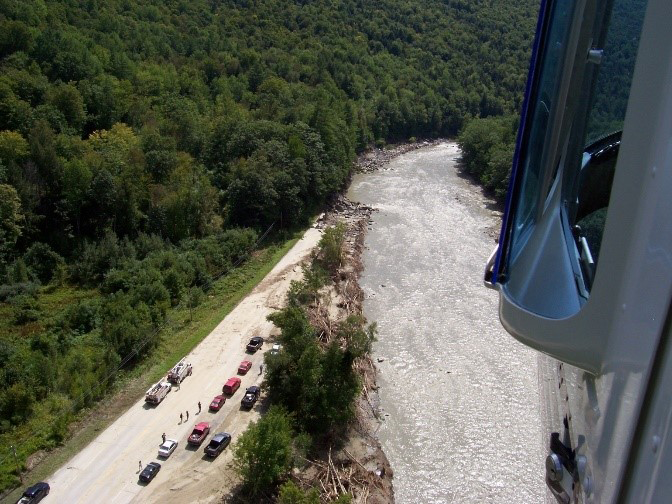
This work has been conducted in East Coast states as well. The Vermont Agency of Transportation (Vtrans) developed an in-house tool for identifying risk levels for roads, bridges, and culverts. The Transportation Resilience Planning Tool (TRPT) takes into account measures of Vulnerability, Criticality, Risk, and Mitigation for its four areas of analysis. Additionally, Vtrans has made the Tool available as a web-based application for ease of use. For example, an examination of the roadway network near East Dorset, Vermont, shows a stretch of the Ethan Allen Highway with a 9/10 Vulnerability score, and 7/10 Criticality score. Because this segment’s right-of-way overlaps with that of an adjacent river, it is particularly vulnerable to erosion. The Tool also contains suggested countermeasures, which in this case include strategies such as planting more vegetation, armoring the riverbank and road, and more costly measures, like adjusting the road’s alignment. Cost estimates for these actions are also given.
Nearby, in Maine, the state department of transportation (MaineDOT) recently completed and published a survey of undersized culverts in the state. The purpose of this work was to identify locations where flooding on the state roadway network might most likely occur, and, in a granular fashion, identify necessary improvements. On the interactive ArcGIS application, one randomly selected culvert on Interstate 395 in Bangor (Fig. 6), was listed as needing an additional one to ten feet expansion, while another, on a nearby clover leaf, needed none. State agencies in Illinois and Delaware have been compiling similar inventories to those in California and Vermont.
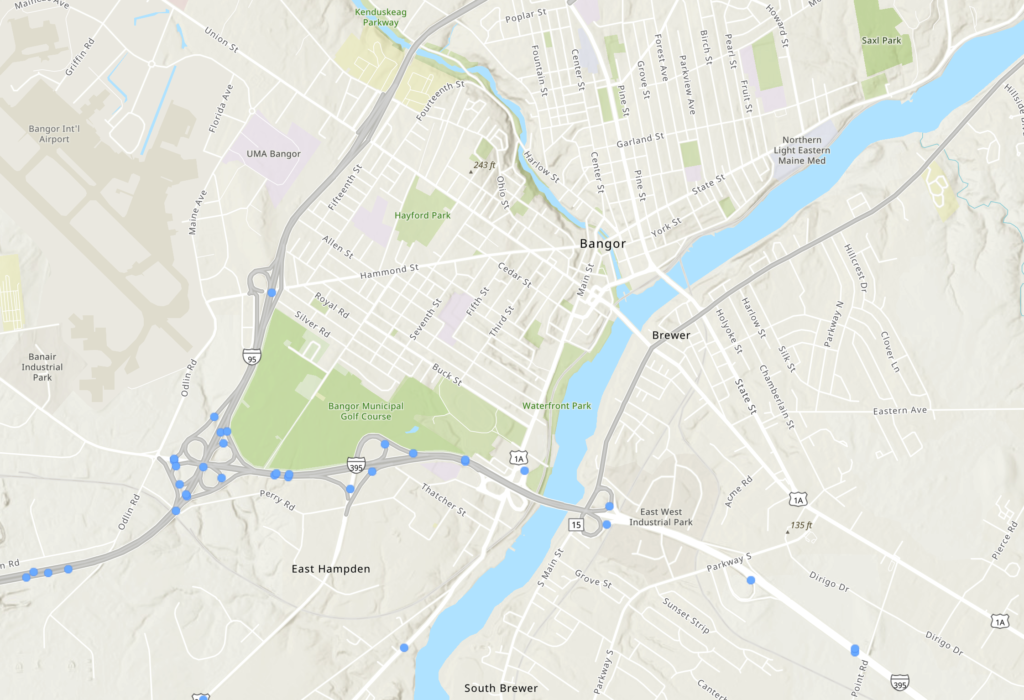
The purpose of such work, in the context of a changing climate, is to understand, on a granular level, the weaknesses and strengths of the state’s system, and then to develop a systematic plan of action. Hawaii, after doing so, found that 58 percent of the state’s highway network was vulnerable to climate-borne stresses. Hawaii’s plan then called for including these considerations in the department’s technical and process guidance, so that, infrastructure could be adapted to face assessed threats in the future.
Mapping Coastal Resilience
In New Jersey, work to expand the NJDOT Flood Risk Visualization Tool is underway. At the 2020 NJDOT Research Showcase, Jon Carnegie, Executive Director of the Alan M. Voorhees Transportation Center at Rutgers University, presented on work from a research team tasked with assisting NJDOT in assessing growing flood risk for the road network by developing the GIS-based Flood Risk Visualization Tool. The first phase of the tool was released in December, 2020, allowing NJDOT to use coastal data from NJFloodMapper and inland flooding data from FEMA to flag areas that may be adversely affected by climate change. The second phase will involve modeling flooding scenarios from specific storm events, thereby enabling NJDOT engineers and planners to effectively assess vulnerability and integrate it into the decision-making process. When finished, this internal tool will allow staff to “zoom-to” particular segments or mile-posts of the state highway network, and view the climate-borne challenges that a particular asset might face.
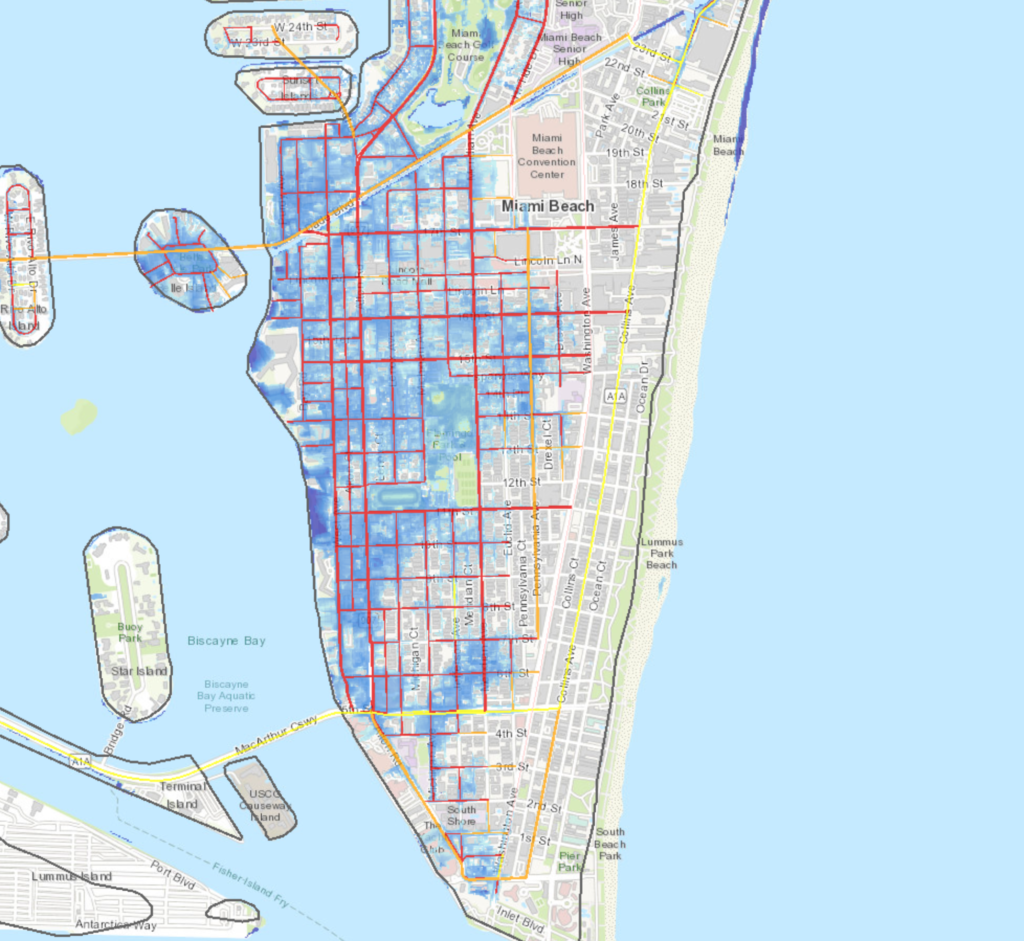
For instance, in the event of a 1-ft sea-level rise (which Rutgers scientists predict is likely to occur by 2070), the current mapping application shows the devastating effects of a Category 2 hurricane on Atlantic City, dramatically worsening the storm’s flooding impacts. The Florida Department of Transportation (FDOT), in association with the University of Florida GeoPlan Center, have developed something similar, the Sea Level Scenario Sketch Planning Tool. This application specifically focuses on transportation infrastructure, showing, for example, a 2070 scenario in Miami Beach (Fig. 7) that illustrates sea-level rise (SLR) affecting a majority of roads on the barrier island. The NJFloodMapper also models SLR, with projections for rising seas to begin consuming the Jersey Shore.
Resiliency at NJDOT
Here in New Jersey, NJDOT is currently engaged in an enterprise-wide effort to integrate resiliency into major functions. The department’s intention is to establish resilience as an adoptive policy for the agency, in a manner similar to that of Complete Streets.
Driven by goals set out in the 2021 State of New Jersey Climate Change Resiliency Strategy, NJDOT and agency partners are collaborating to integrate resiliency in a variety of ways. For example, NJDOT is working with the Department of Environmental Protection (NJDEP) to effectively predict shifting rainfall patterns’ effects on flooding, which will be used to update stormwater management guidance. Another initiative in the strategy calls for coordinated, cross-agency regional sediment management plans, for the purpose of properly re-using dredged material for resiliency improvements, such as elevating marshes or potentially creating new near-shore islands. To mitigate the complex threats of climate change, such multidisciplinary collaboration is required.

At NJDOT, several technical tools are being developed to support these efforts. The Flood Risk Visualization Tool, mentioned above, is one example. Another is a Criticality Tool, which analyzes data on infrastructure assets, and will assist staff in discerning the most essential pieces of the transportation system. The Climate Hazard Visualization Tool will help staff to “red flag” potential points of exposure, particularly regarding storm surge and flooding.
With these tools in place, resiliency will be integrated into workflows, for instance, becoming a component under consideration in the concept development process, impacting the outcome of preliminary engineering or design work.
Assessment-Informed Decisionmaking
The Pennsylvania Climate Action Plan, in its climate adaptation section for built infrastructure, makes the financial case for resilience investments: “for every $1 invested by the public sector in disaster mitigations, $6 is saved in recovery costs.” This figure, culled from a cost-benefit analysis from the National Institute of Building Sciences, makes a powerful argument for making necessary but expensive resilience investments.
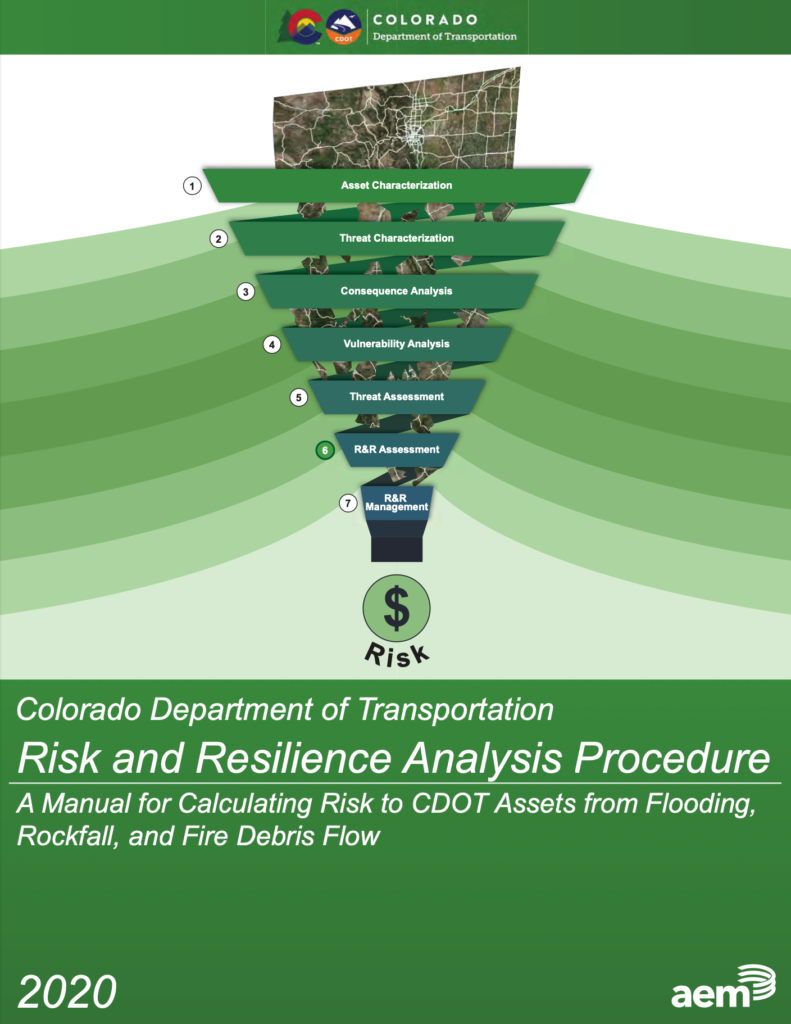
CDOT’s Risk and Resilience Analysis Procedure (2020) stands out for the economic considerations and educational tools that the manual provides to build the capabilities of agency staff to conduct analyses and calculate costs. With sample problems, the resource walks through how to conduct such an assessment, including components such as user consequence (such as lost time or damage), and owner risk (such as cleanup and restoration costs), which are summed and presented as an annual figure, in dollars.
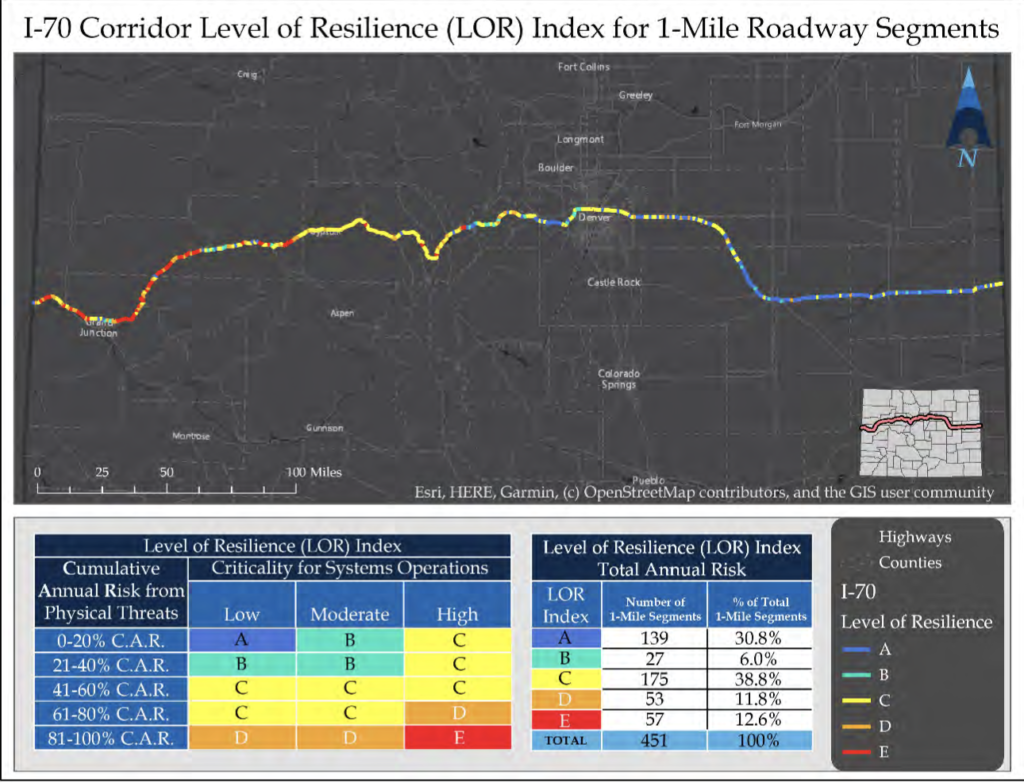
Consultants created a criticality score (including elements such as traffic, freight value, tourism, etc.), to gauge a particular state highway network asset’s importance to the overall vitality of the state’s economy. In the agency’s example, a Level of Resilience (LOR) index was created for 1-mile roadway segments across the I-70 Corridor. The Index takes into account each segment’s criticality for systems operations, as well as cumulative annual risk, and assigns each a letter grade. After sections of a corridor are graded according to the LOR Index, certain segments can be strategically targeted. In these areas, an economic analysis, to study the efficacy of making resilience improvements, is to be performed. The Risk and Resilience Procedure provides sample cases of such analyses.
For example, risk management for a minor culvert is performed as follows: total annual risk, which would continue without a mitigation, is calculated as $260,424. For the next step, a proposed mitigation, in this case replacing the existing culvert with a 72-inch RCP pipe, is said to cost $500,000. Now, a risk assessment is calculated as if the new pipe were in place—total annual risk drops to $51,114. On the fourth and final step, the economic analysis is performed, to see if this intervention is worthwhile. First, the mitigation benefit is calculated as the total annual risk from the mitigation ($51,114) subtracted from the baseline total annual risk ($260,424), leading to a positive mitigation benefit of $209,310. Then, the ultimate Benefit-Cost (BC) ratio is assigned. In this case, the $500,000 pipe mitigation is given a $17,168 annual cost, which serves as the denominator in the ultimate calculation: Annual mitigation benefit divided by annual mitigation cost (B/C), or $209,310 divided by $17,168. Here, B/C = 12.2, well over the value of 1 needed to prove that the mitigation is economically viable. Thus, the new pipe in the culvert will be a worthwhile investment.
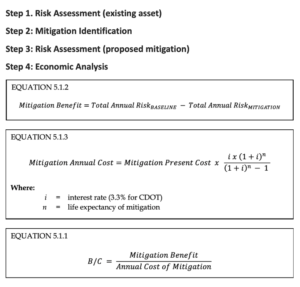
Using the formulas and steps laid out in the resource, CDOT staff may calculate the risk of flooding in a major culvert, or a post-fire debris flow in a tunnel, such as what occurred in Glenwood Canyon on I-70 in July 2021. With this framework in place, the agency is able to make informed decisions about how to prioritize resiliency investments, and strategically mitigate future disasters.
In Washington State, a 2015 FHWA-sponsored pilot study looked to transition from risk assessment to developing a scenario-planning and decision-making framework. Creating a Resilient Transportation Network in Skagit County: Using Flood Studies to Inform Transportation Asset Management examines adaptation options for state transportation facilities in the vulnerable Skagit River Basin. The pilot combines information from WSDOT’s previous comprehensive risk assessment with the results of a flood study from the U.S. Army Corps of Engineers. However, had the planners been unaware of a plan to improve and extend levees in the region, their suggested alternatives would have been misinformed, leading to what is termed maladaptation. “There is a synergy that comes from combining our efforts.” the report concludes. “When we work together, we can find solutions that might not be possible, and avoid problems that might occur.”
Conclusion
The methods outlined in this article, while by no means encompassing the scope of resiliency efforts underway at state DOTs in the Unites States, provide a glimpse into how some transportation agencies are approaching the threat of climate change. Broadly speaking, there is a need to comprehensively inventory infrastructure, grading it based on levels of criticality and vulnerability, and then to develop a phased plan detailing how resiliency measures will be taken.
Because there are many DOTs considering this issue, it is beneficial to examine their various approaches, especially in states with weather and infrastructure networks similar to New Jersey’s. While Colorado, with its mountains, wildfires, and mudslides, varies wildly with the East Coast, CDOT can be seen as a leading model for the process of climate resiliency planning. The preponderance of threats motivated the agency to develop a response plan early on, which now provides a toolkit and road map for its statewide resiliency work. The threat of climate change is great, but it brings with it an opportunity to innovate, to develop new processes and technologies that make a stronger, safer network for the traveling public.
Bibliography
Caltrans. (2020, December). Adaptation Priorities Report: District 4. Caltrans. https://dot.ca.gov/-/media/dot-media/programs/transportation-planning/documents/2020-adaption-priorities-reports/d4-adaptation-priorities-report-2020-v2-a11y.pdf
Colorado Department of Transportation. CDOT Resilience Program. Colorado Department of Transportation. https://www.codot.gov/programs/planning/cdot-resilience-program
Colorado Department of Transportation. (2020). Risk and Resilience Analysis Procedure. Colorado Department of Transportation. https://www.codot.gov/programs/planning/cdot-rnr-analysis-procedure-8-4-2020-v6.pdf
Commonwealth of Pennsylvania. (2021). Pennsylvania Climate Action Plan. Commonwealth of Pennsylvania. https://www.dep.pa.gov/citizens/climate/Pages/PA-Climate-Action-Plan.aspx
Delaware Department of Transportation. (2017, July). Strategic Implementation Plan for Climate Change, Sustainability & Resilience for Transportation. Delaware Department of Transportation. https://deldot.gov/Publications/reports/SIP/pdfs/SIP_FINAL_2017-07-28.pdf
Federal Highway Administration. (2017, December). Vulnerability Assessment and Adaptation Framework, Third Edition. Federal Highway Administration. https://www.fhwa.dot.gov/environment/sustainability/resilience/adaptation_framework/climate_adaptation.pdf
Florida Department of Transportation. Resiliency Subject Brief. Florida Department of Transportation. https://fdotwww.blob.core.windows.net/sitefinity/docs/default-source/planning/policy/briefing_sheets_resilience_0630.pdf?sfvrsn=1173ebf_2
Hawaii Department of Transportation. (2021, May). Hawaii Highways Climate Adaptation Action Plan: Strategies for a More Resilient Future. Hawaii Department of Transportation. https://hidot.hawaii.gov/wp-content/uploads/2021/07/HDOT-Climate-Resilience-Action-Plan-and-Appendices-May-2021.pdf
Illinois Department of Transportation. Long-Range Transportation Plan. Illinois Department of Transportation. https://idot.illinois.gov/Assets/uploads/files/About-IDOT/Misc/Planning/IDOT_LRTP_5_Resiliency_Final.pdf
Iowa Department of Transportation. (2018, February). Interstate 380 Planning Study (PEL): Evaluation of I-380 Resiliency and Vulnerability. Iowa Department of Transportation. https://iowadot.gov/i380planningstudy/pdfs/I380_TechMemo_ResiliencyReport.pdf
Massachusetts Department of Transportation. (2015, June). MassDOT-FHWA Pilot Project Report: Climate and Extreme Weather Vulnerability Assessments And Adaptation Options for the Central Artery. Massachusetts Department of Transportation. https://www.mass.gov/files/documents/2018/08/09/MassDOT_FHWA_Climate_Change_Vulnerability_1.pdf
Metropolitan Transportation Commission. (2011). Adapting to Rising Tides: Transportation Vulnerability and Risk Assessment Pilot Project. Metropolitan Transportation Commission. http://www.adaptingtorisingtides.org/wp-content/uploads/2015/04/RisingTides_TechnicalReport_sm.pdf
National Cooperative Highway Research Program. (2019, March 15). Applying Climate Change Information to Hydrologic and Coastal Design of Transportation Infrastructure. Transportation Research Board. http://onlinepubs.trb.org/onlinepubs/nchrp/docs/NCHRP1561DesignPracticesGuide.pdf
National Cooperative Highway Research Program. (2020). Incorporating the Costs and Benefits of Adaptation Measures in Preparation for Extreme Weather Events and Climate Change Guidebook. Transportation Research Board. http://nap.edu/25744
National Cooperative Highway Research Program. (2018). Resilience in Transportation, Planning, Engineering, Management, Policy, and Administration. Transportation Research Board. http://nap.edu/25166
National Cooperative Highway Research Program. (2021). Transportation System Resilience: Research Roadmap and White Papers. Transportation Research Board. http://nap.edu/26160
New York State Department of Transportation. BRIDGE NY. New York State Department of Transportation. https://www.dot.ny.gov/BRIDGENY
State of New Jersey (2021). State of New Jersey Climate Change Resiliency Strategy. State of New Jersey. https://www.nj.gov/dep/climatechange/resilience-strategy.html
Transportation Research Board. (2020, September), Transportation Research Circular: Transportation Resilience 2019: 2nd International Conference on Resilience to Natural Hazards and Extreme Weather Events. Transportation Research Board. http://onlinepubs.trb.org/onlinepubs/circulars/ec265.pdf
Turnbull, Katherine. (2016). Transportation Resilience: Adaptation to Climate Change. National Academies of Sciences, Engineering, and Medicine. http://nap.edu/24648
University of Texas at Arlington. (2013). Climate Change/Extreme Weather Vulnerability and Risk Assessment for Transportation Infrastructure in Dallas and Tarrant Counties. North Central Texas Council of Governments. https://cpb-us-e1.wpmucdn.com/blog.uta.edu/dist/3/4734/files/2018/06/NCTCOG_FHWAClimateChangePilot_RevisedFinal_3-24-15-1piorzb.pdf
Vermont Agency of Transportation. (2019, January 31). User Guide for the Vermont Transportation Resilience Planning Tool. Vermont Agency of Transportation. https://vtrans.vermont.gov/sites/aot/files/planning/documents/planning/TRPT%20User%20Guide%201.0.pdf
Washington State Department of Transportation. (2011, November). Climate Impacts Vulnerability Assessment. Washington State Department of Transportation. https://wsdot.wa.gov/sites/default/files/2011/07/28/Climate-Impact-AssessmentforFHWA-12-2011.pdf
Washington State Department of Transportation. (2015). Creating a Resilient Transportation Network in Skagit County: Using Flood Studies to Inform Transportation Asset Management. Washington State Department of Transportation. https://wsdot.wa.gov/publications/fulltext/design/Skagit_County_Report_Appendices.pdf
Yang, David Y., and Frangopol, Dan M. (2019, November). Physics-Based Assessment of Climate Change Impact on Long-Term Regional Bridge Scour Risk Using Hydrologic Modeling: Application to Lehigh River Watershed. Journal of Bridge Engineering. https://ascelibrary.org/doi/10.1061/%28ASCE%29BE.1943-5592.0001462

