Testing Biometric Sensors for Use in Micromobility Safety

Biometric sensors have long been used in cognitive psychology to measure the stress-level of individuals. These sensors can measure a variety of human behaviors that translate as stress: the movement of eyes, stress-induced sweat, and heart rate variability. Recently, this research strategy has moved beyond psychology and into disciplines like transportation planning, to provide an alternative approach to researching micromobility and stress.  

We spoke with Dr. Wenwen Zhang, associate professor at the Edward J. Bloustein School of Planning and Public Policy at Rutgers University, about her experience learning about and using biometrics for a micromobility study. Dr. Zhang’s research, “Rider-Centric Approach to Micromobility Safety” examines the stress levels of micromobility users as they transverse a varied path through an urban space.  


Q. How is your research funded? 

A. Funding comes from multiple sources. The first source is a seed grant from the Rutgers Research Council which supports an interdisciplinary pilot project. Through this grant, we purchased biometric sensors and hired students to conduct a literature review and develop a research design. We also processed the collected pilot data and paid for participation incentives under this funding. I presented preliminary findings from this study, Rider-Centric Approach to Micromobility Safety, at the 2023 NJDOT Research Showcase. At the time that I presented it, I had 24 samples. The presentation ended up inspiring several people who attended the Research Showcase to volunteer as participants—which increased the sample size to 30.

Our other source of funding came from an external grant from the C2Smart University Transportation Center (UTC) at NYU. We used this resource to support obtaining additional stress sensors, data analysis, cleaning, preprocessing, and modeling, as well as collecting more sample data for the E-scooter and bicycle experiments.

Q. How did you get interested in using biometrics sensors (e.g., eye tracking glasses, galvanic skin sensor, heart rate monitors) to study micromobility safety? How does this research differ from your past work? 

A. Before I used biometric sensors, most of my work used passive travel behavior data. For example, to determine the revealed preferences of mode and route choices and risk factors, we used travel trajectory or existing crash big data to develop statistical models. I have found that the entire process is very passive, especially since we only explore risk factors after traffic accidents. It’s surprising that in the research field today we know so little about how human beings actually navigate urban environments while using different travel modes and how it relates to perceived safety. I wanted to explore questions like what is their gaze behavior? How do they feel while they travel using different modes? How do they feel traveling on roads with different design features and how is that going to influence their travel satisfaction or experience overall? 

Dr. Robert Noland, Distinguished Professor at the Rutgers Bloustein School, suggested I investigate the use of biometrics in planning studies. As I dug more into the literature, I realized that biometrics in transportation is a very fascinating topic that I wanted to get into. Once I did experiments in the field, I realized that I really enjoyed talking with different people about how they perceive the built environment while they travel. Biometrics provide richer data compared with revealed preference data that I used to work with.

Q. In your research, you noticed that some corridors were more stress-inducing (according to biometric sensors) than expected, despite properly designed safety infrastructure. How do you think this discovery may affect how planners and engineers look at urban road design and micromobility safety? 

 A. This study collected one-time cross-sectional data. We asked people to walk around an area and tell us whether they feel stressed or not. If they are feeling stress, even in the presence of a safety improvement, it does not necessarily mean that the implemented safety design is not working. For example, in New Brunswick, we observed that a lot of people found it stress-inducing to cross Livingston Avenue, although it has been the subject of a road diet and has several pedestrian safety features incorporated into the new design. While outside our scope of research, one way to understand the impact of the safety infrastructure would be to conduct a “before” and “after” study. This leaves an opportunity for more research, to see how effective the pedestrian-only infrastructure is in reducing stress level. Potentially, it can provide evidence to support pedestrian-only design. Biometric sensors used in a “before and after” study can help us to answer which infrastructure is more preferred. 

Q. You are in the process of collecting data for cyclists and e-scooters using the same method, what are your principal objectives in addressing this segment? Do you expect the results to be different?
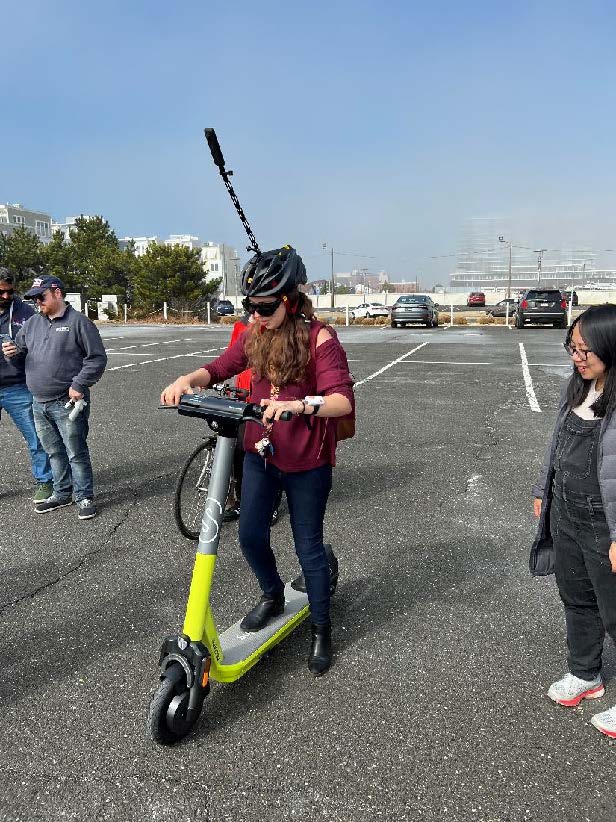
Dr. Zhang conducted one pilot e-scooter experiment at Asbury Park, NJ in 2022 to test out the devices and examine how to set up research experiments. She equipped the e-scooter rider, Dr. Hannah Younes, post-doc researcher at the Rutgers Bloustein School, with an eye tracking glass, a GSR sensor on the hand, and a 360-degree camera on top of the helmet.

A. Yes, absolutely, different travel modes will likely alter a person’s expectation for a safe travel environment. For example, we noticed a big difference in the enjoyment of pedestrians and e-scooters on the same path through a park. We had thought that the e-scooter users would enjoy the ride as the pedestrians had, however, the pavement was too rough for the small wheels of the e-scooters. Although the park was walking-friendly, it was not friendly for e-scooters. This shows that each of these micromobility modes needs different kinds of support to feel safe and comfortable.

Q. What are the limitations to this study? Do you have plans for future research to address this? How would you like to expand your research in this topic?

A. Each of the biometric sensors has limitations. For example, eye trackers face some difficulty when identifying the pupils of a participant in direct sunlight. As a result, the eye tracker renders a low eye tracking rate. Eye trackers also work better with darker eyes as the eye movements are more readily recognized. The eye trackers, kept on glasses, also restrict individuals who wear glasses from participating. The unfortunate result of this is that it often excludes a lot of senior people from the experiment. This issue may be alleviated as we are obtaining additional funding to obtain prescription lenses for eye trackers.

GSR sensors use low voltage on skin to measure skin conductivity, which may interfere with electric health devices. This limits individuals from participating if they have an electric health device like a pacemaker on or in their body. We purposefully excluded this population from participating to align with IRB (Institutional Review Board) protocol and to mitigate any risks.

Another limitation of the study is that we must collect sample data one by one, which is a time-consuming process. We can only collect a very small sample compared to a traditional statistical model kind of study, which may have access to thousands of records in the sample. From our literature review, biometrics sensor studies typically involve 20 to 30 participants, but for each participant we have a very rich dataset. For each participating volunteer, we end up with over one gigabyte of data. The limited number of participants may make it harder to generalize results to the entire population, and people may question the results applicability. In some ways this data is similar to the results of qualitative studies, where we have richer information but small sample size, rendering some generalizability issues. 
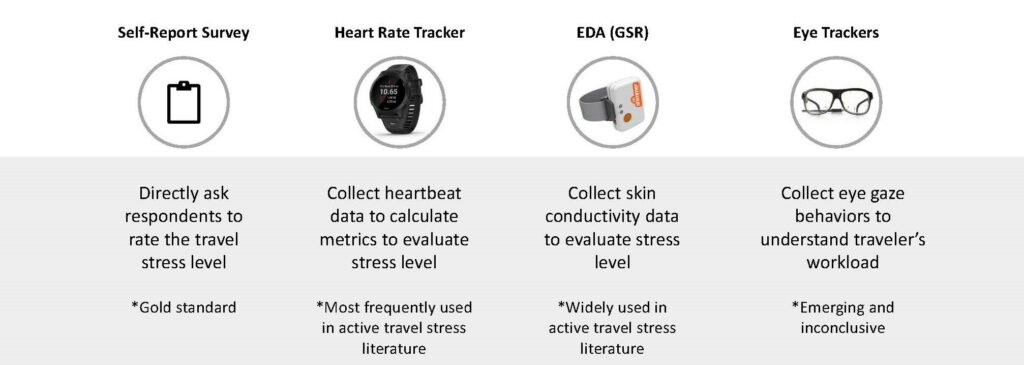
Feelings of safety were measured using the traditional self-report survey as well as biometric trackers like Heart Rate Trackers, Eye trackers and GSR (pictured above).

Q. What challenges have you found in working with biometrics sensors, or in the interpretation of output measures?

A. The eye tracker and heart rate measures are reliable, but some biometrics have posed challenges. The GSR (galvanic skin response sensor), which tests your sweat level, is very sensitive to humidity and time of the day. The sensor also picks up on sweat resulting from physical exertion, making it difficult to distinguish between stress-induced sweat and physical sweat.

Interpretation of output measures for this metric requires data cleaning and processing to eliminate the effect of sweating from physical exertion. We try to decompose the data to separate the emotional peak from the sweating caused by physical activity using various algorithms. We are still underway testing out different algorithms to clean up the data. So far, we have found that GSR data are very real-time in nature and a good indicator for stress level but are very noisy data and requires some manual processing. This means we spend a lot of time preprocessing the collected data before conducting data analysis. 

Q. How do you expect this research to inform transportation agencies in New Jersey and elsewhere?

A. This type of research captures such rich data on travel behavior itself. Most of the literature using biometrics has been focused on driving, so this research expands the perspective. Here we’re focusing on slow mobility, like active travel and micromobility. Individuals who participate in slow mobility are more vulnerable road users, and we want to see how they behave in different travel environments. This can help agencies gain more insights into how to design safety infrastructure. Beyond that I can also envision the technology being used to evaluate whether certain improvements or infrastructure designs help to improve travel satisfaction or improve people’s experience at the same location by doing “before and after” studies. This type of study also allows you to measure and quantify the effect of the improvement. 

The use of biometric sensors in the field can also be used to foster meaningful public engagement processes to show the lived experience of different people in a neighborhood or traveling through a different corridor, which can be very powerful.

Q. Do you feel the research methods are at a stage where they are “ripe” for use on other demonstration projects, planning or project development studies?

A. After one year of experimentation, our project team can readily work with biometrics. We have a good understanding of sensor limitations and how to set up the sensors to correctly reduce noise as much as possible. Our experience has also helped determine what kind of metrics can be extracted successfully and reliably through the sensors.  

The most useful case for those sensors is to evaluate before and after, so that we can quantify how much people appreciate those implementations in a more accurate way. Beyond that, the sensors can also be effective infrastructure assessment tools. For example, imagine that you ask people to wear biometric sensors and do a bicycle infrastructure evaluation; the agencies can get more realistic and rich data compared with a more traditional survey approach. This rich data can help determine the most effective improvement. It ends up being more inclusive that way.

The tools can be very useful for fostering community engagement with vulnerable populations. For example, if agencies want to improve the accessibility for wheelchair users, they can ask individuals in wheelchairs to wear the sensors and move about an area. Recording and reviewing how they experience a journey is more powerful compared with just asking individuals with needs about their travel patterns. It’s going to be a more straightforward way to show the world how we can make the streets more inclusive for those vulnerable populations. 

Q. Do you think local governments and non-governmental organizations could make use of biometrics sensors as a strategy to promote community engagement and outreach to local communities, or to address specific community safety or livability issues?  Would it be cost-prohibitive to employ such tools for such community-based planning issues at this time?  

A.  From my point of view, the most effective way would be for the agencies to identify where there are needs and promising projects and then work with skilled researchers or practitioners who have these sensors already and have begun to climb the learning curve in the use of sensors and interpretation — for example, they could work with us. They would need to pay for the researchers’ time and participation incentives, or if they were to collaborate with a UTC (University Transportation Center) to conduct such research collaboratively.  

The sensors are not the most expensive part of the study. The most expensive item is the researcher’s time to collect and analyze the data. The data are very complicated to analyze in the first place because it’s a large amount of data with noises. The researchers need to put in a lot of time to get it to the state where you can extract the relevant variables out and start to interpret them.

Q. How would you characterize the “state-of-training” in using biometrics for students or early career or mid-career professionals in transportation?    

A. The biometric sensor itself is not very new, but new to the transportation field, especially for slow modes. It has been widely used in cognitive psychology, where there are classes to interpret those as well. Generally, I don’t think the current transportation and urban planning curriculum for students includes enough classes to cover those sensors. We probably need to teach not only biometric sensors, but urban sensing in general. 

In an ideal course, students could get their hands dirty by putting those sensors in the field and then once the data are collected, they can learn how to preprocess and analyze the data. It would have to be a one-year kind of curriculum design to get people involved and ready for it. Of course, instruction on the use of sensors will differ by topic. For example, if you are working in the air quality field, then there are many different air quality sensors and each of them come with different data formats and require different experiment design and analytic skills.

Regarding the mid-career transportation professional, at this moment I believe the research is more in the academic field and focusing on testing and evaluation. I wouldn’t suggest that the research is so ripe that a mid-career transportation or urban planner professional should need to invest their time in learning how to use biosensors unless they have a research project that may benefit substantially from using the sensors.  


Resources

To learn more about the use of biometrics in the field of active transportation, see:

Ryerson, M., Long, C., Fichman, M., Davidson, J.H., Scudder, K.N., Kim, M., Katti, R., Poon, G. & Harris, M., (2021). Evaluating Cyclist Biometrics to Develop Urban Transportation Safety Metrics. Accident Analysis & Prevention, Volume 159, 2021. Retrieved from https://www.sciencedirect.com/science/article/pii/S0001457521003183?via%3Dihub

Fitch, D.T., Sharpnack, J. & Handy, S. (2020). Psychological Stress of Bicycling with Traffic: Examining Heart Rate Variability of Bicyclists in Natural Urban Environments. Transportation Research Part F: Traffic Psychology and Behavior, Volume 70, 2020, Pages 81-97. Retrieved from https://www.sciencedirect.com/science/article/pii/S1369847819304073?via%3Dihub.

To read more on Dr. Zhang’s work, see:

Zhang, W. (2023). Rider-centric Approach to Micromobility Safety. 25th Annual NJDOT Research Showcase. Presentation. Retrieved from https://www.njdottechtransfer.net/wp-content/uploads/2023/11/Zhang-Safety-2nd-Presentation.pdf.

Zhang. W. 25th Annual NJDOT Research Showcase. Recording starts at: 59:00. Retrieved from https://youtu.be/D_rQP-Dv8gU

Zhang, W., Buehler, R., Broaddus, A. & Sweeney, T. (2021). What Type of Infrastructures do E-scooter Riders Prefer? A Route Choice Model. Transportation Research Part D: Transport and Environment, Volume 94, 2021. Retrieved from https://www.sciencedirect.com/science/article/pii/S1361920921000651.

For more information about the use of biometrics in the broader transportation field, see NYU’s C2SMART’s research project on Work Zone Safety:

Zone for AI to look for trespassing at railroad crossing

Research Spotlight: Exploring the Use of Artificial Intelligence to Improve Railroad Safety
Partnering with the Federal Railroad Administration, New Jersey Transit and New Jersey Department of Transportation (NJDOT), a research team at Rutgers University is using artificial intelligence (AI) techniques to analyze rail crossing safety issues. Utilizing closed-circuit television (CCTV) cameras installed at rail crossings, a team of Rutgers researchers, Asim Zaman, Xiang Liu, Zhipeng Zhang, and Jinxuan Xu, have developed and refined an AI-aided framework for detection of railroad trespassing events to identify the behavior of trespassers and capture video of infractions.  The system uses an object detection algorithm to efficiently observe and process video data into a single dataset.

Rail trespassing is a significant safety concern resulting in injuries and deaths throughout the country, with the number of such incidents increasing over the past decade. Following passage of the 2015 Fixing America’s Surface Transportation (FAST) Act that mandated the installation of cameras along passenger rail lines, transportation agencies have installed CCTV cameras at rail crossings across the country.  Historically, only through recorded injuries and fatalities were railroads and transportation agencies able to identify crossings with trespassing issues. This analysis did not integrate information on near misses or live conditions at the crossing. Cameras could record this data, but reviewing the video would be a laborious task that required a significant resource commitment and could lead to missed trespassing events due to observer fatigue.

Zaman, Liu, Zhang, and Xu saw this problem as an opportunity to put AI techniques to work and make effective use of the available video and automate the observational process in a more systematic way. After utilizing AI for basic video analysis in a prior study, the researchers theorized that they could train an AI and deep learning to analyze the videos from these crossings and identify all trespassing events.

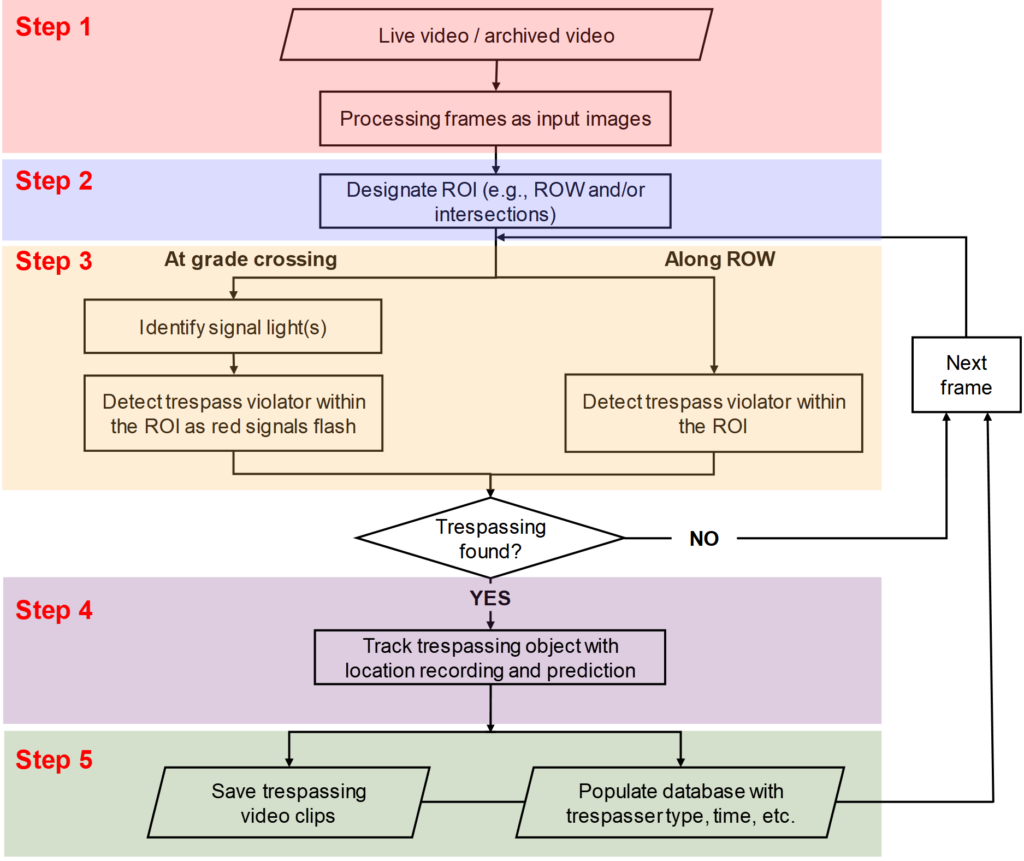
Working with NJDOT and NJ TRANSIT, they gained access to video footage from a crossing in Ramsey, NJ.  Using a deep learning-based detection method named You Only Look Once or YOLO, their AI-framework detected trespassings, differentiated the types of violators, and generated clips to review. The tool identified a trespass only when the signal lights and crossing gates were active and tracked objects that changed from image to image in the defined space of the right-of-way. Figure 1 depicts the key steps in the process for application of AI in the analysis of live video stream or archived surveillance video.

Figure 1. General YOLO-Based Framework for Railroad Trespass Detection illustrates a step-by-step process involving AI algorithm configurations, YOLO-aided detection, and how trespassing detection incidents are saved and recorded to a database for more intensive analysis and characterization (e.g., trespasser type, day, time, weather, etc.)

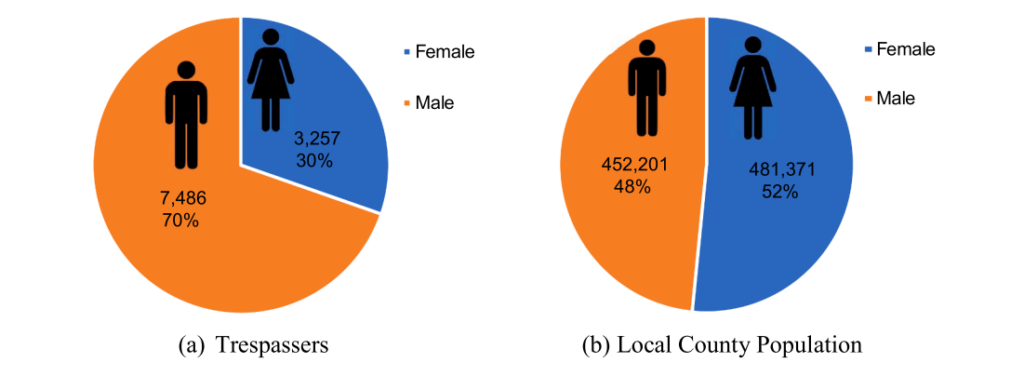
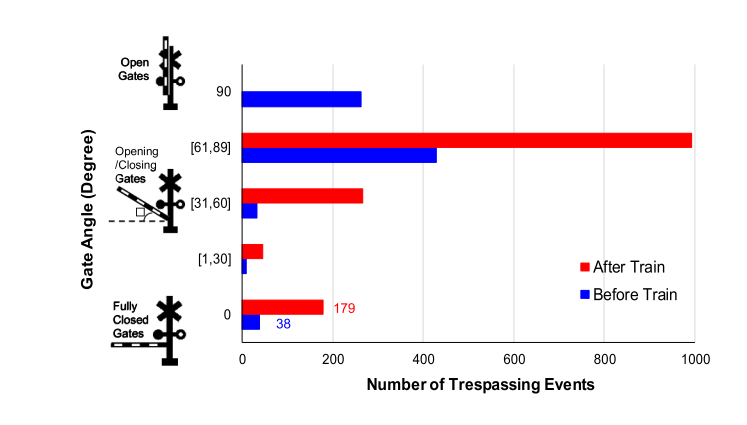
The researchers applied AI review to 1,632 hours of video and 68 days of monitoring. They discovered 3,004 instances of trespassing, an average of 44 per day and nearly twice an hour. The researchers were able to demonstrate how the captured incidents could be used to formulate a demographic profile of trespassers (Figure 2) and better examine the environmental context leading to trespassing events to inform the selection and design of safety countermeasures (Figure 3).

Figure 2: Similar to patterns found in studies of rail trespassing fatalities, trespassing pedestrians were more likely to be male than female. Source: Zhang et al
Figure 3: Trespassing events were characterized by the gate angle and timing before/after a train pass to isolate context of risky behavior. Source: Zhang et. al

A significant innovation from this research has been the production of the video clip that shows when and how the trespass event occurred; the ability to visually review the precise moment reduces overall data storage and the time needed performing labor-intensive reviews. (Zhang, Zaman, Xu, & Liu, 2022)

With the efficient assembly and analysis of video big data through AI techniques, agencies have an opportunity, as never before, to observe the patterns of trespassing. Extending this AI research method to multiple locations holds promise for perfecting the efficiency and accuracy in application of AI techniques in various lighting, weather and other environmental conditions and, more generally, to building a deeper understanding of the environmental context contributing to trespassing behaviors.

In fact, the success of this AI-aided Railroad Trespassing Tool has led to new opportunities to demonstrate its use. The researchers have already expanded their research to more crossings in New Jersey and into North Carolina and Virginia. (Bruno, 2022) The Federal Railroad Administration has also awarded the research team a $582,859 Consolidated Rail Infrastructure and Safety Improvements Grant to support the technology’s deployment at five at-grade crossings in New Jersey, Connecticut, Massachusetts, and Louisiana. (U.S. DOT, Federal Railroad Administration, 2021) Rutgers University and Amtrak have provided a 42 percent match of the funding.

The program’s expansion in more places may lead to further improvements in the precision and quality of the AI detection data and methods.  The researchers speculate that this technology could integrate with Positive Train Control (PTC) systems and highway Intelligent Transportation Systems (ITS). (Zhang, Zaman, Xu, & Liu, 2022) This merging of technologies could revolutionize railroad safety. To read more about this study and methodology, see this April 2022 Accident Analysis & Prevention article.

References

Bruno, G. (2022, June 22). Rutgers Researchers Create Artificial Intelligence-Aided Railroad Trespassing Detection Tool. Retrieved from https://www.rutgers.edu/news/rutgers-researchers-create-artificial-intelligence-aided-railroad-trespassing-detection-tool

NJDOT Technology Transfer. (2021, November 8). How Automated Video Analytics Can Make NJ’s Transportation Network Safer and More Efficient. Retrieved from https://www.njdottechtransfer.net/2021/11/08/automated-video-analytics/

Tran, A. (n.d.). Artificial Intelligence-Aided Railroad Trespassing Data Analytics: Artificial Intelligence-Aided Railroad Trespassing Data Analytics:.

United States Department of Transportation: Federal Railroad Administration. (2021). Consolidated Rail Infrastructure and Safety Improvements (CRISI) Program: FY2021 Selections. Retrieved from https://railroads.dot.gov/elibrary/consolidated-rail-infrastructure-and-safety-improvements-crisi-program-fy2021-selections

Zaman, A., Ren, B., & Liu, X. (2019). Artificial Intelligence-Aided Automated Detection of Railroad Trespassing. Journal of the Transportation Research Board, 25-37.

Zhang, Z., Zaman, A., Xu, J., & Liu, X. (2022). Artificial intelligence-aided railroad trespassing detection and data analytics: Methodology and a case study. Accident Analysis & Prevention.

What is Innovative in the Bipartisan Infrastructure Law? Greater Investment in Safety, Equity, and Climate and Resilience

On November 15, 2021, the Infrastructure Investment and Jobs Act (IIJA), often referred to as the “Bipartisan Infrastructure Law” (BIL), was signed into law.  With the BIL’s passage, the United States has committed approximately $550 billion to transportation infrastructure within a wider $1 trillion + federal reinvestment in the nation’s infrastructure [1].

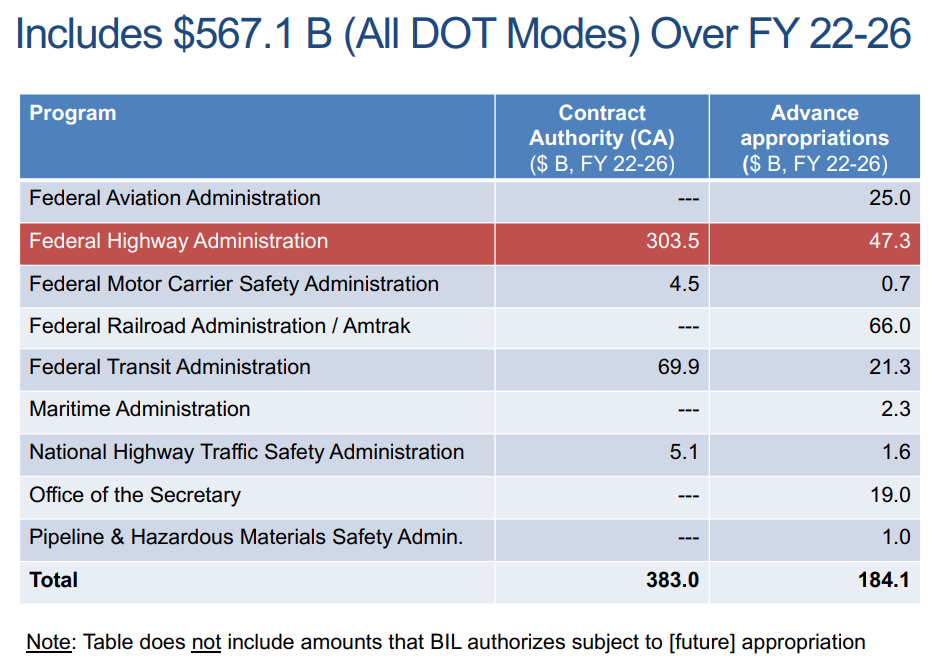
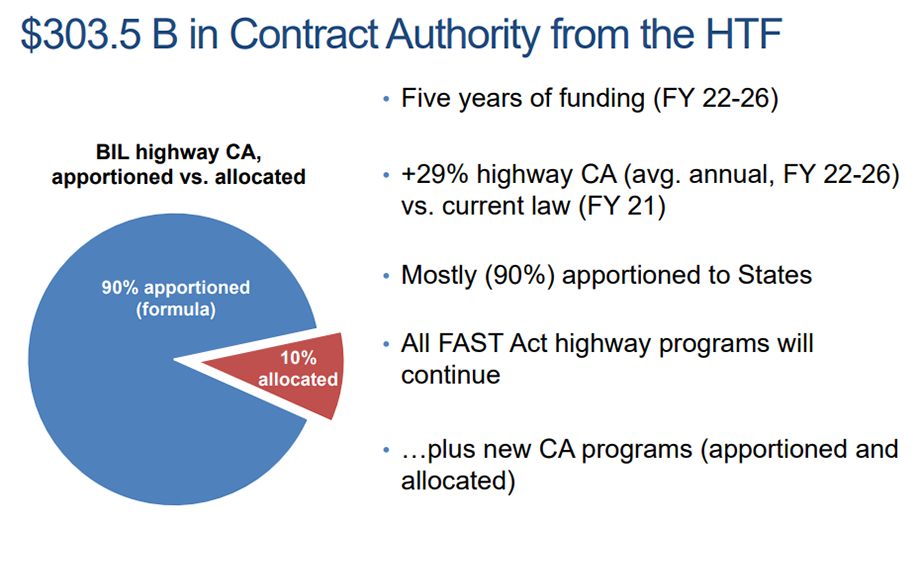
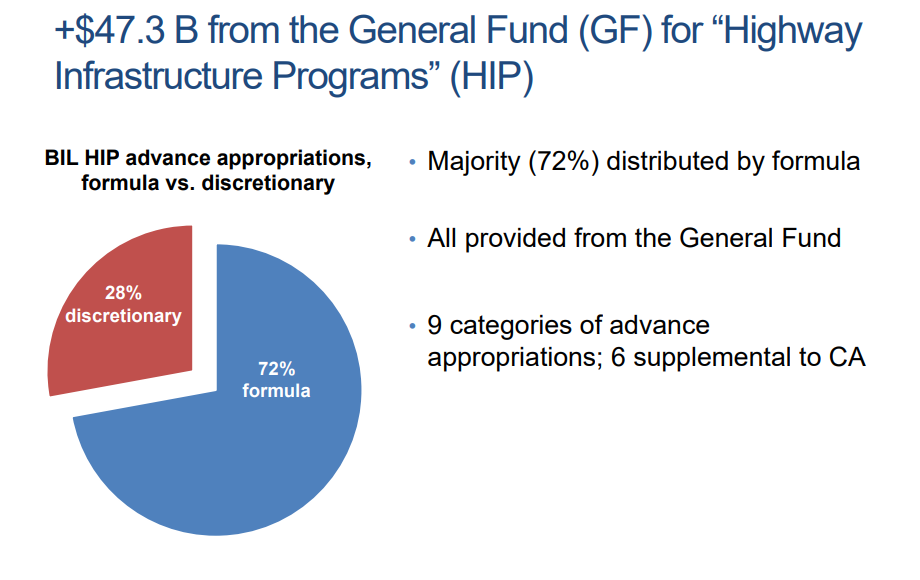
Much of the BIL transportation funding seeks to encourage and prioritize the repair, reconstruction and replacement and maintenance of existing transportation infrastructure with appropriations totaling some $350.8 billion (FY 2022-2026), drawing from the highway trust fund ($303.5 billion) and advance appropriations from the general fund (47.3 billion). Most of the highway funding is apportioned to States based on formulas specified in Federal law.  New Jersey could receive approximately $8.1 billion over five years for highways and bridges, based on the federal highway funding formula, or about 41.6 percent more than the State’s funding under current law [2]. However, the BiL also provides significant funding through various competitive grant programs such as the bridges and megaprojects that can demonstrate substantial economic benefits.  New Jersey’s Portal North Bridge under construction in Secaucus reportedly may meet the requirements for a Capital Investment Grant for transit projects [2].


All U.S. DOT modes will receive transportation funding from BiL with the greatest amount handled through the Federal Highway Administration (FHWA).
Most of the highway trust funding is apportioned by formula to the states.
A great deal of the BiL funding being directed for HIPs from the General Fund is formula-based.
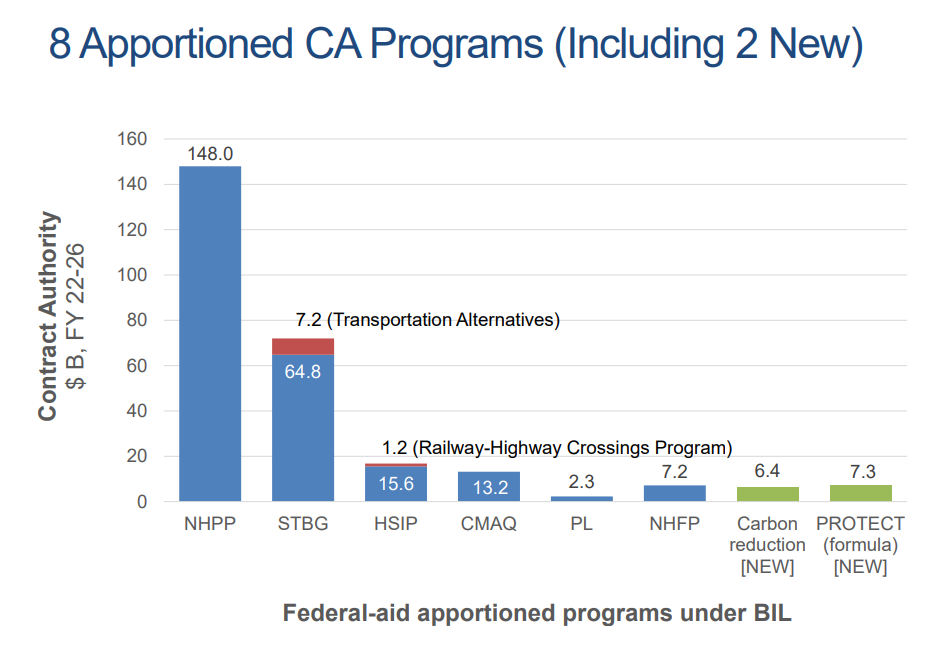
Two new climate-focused programs, the Carbon Reduction Program and PROTECT, together match the scale of funding set aside for CMAQ—widening the scope of environmental concerns beyond congestion mitigation and air quality.

Notably, the BIL takes innovative steps in the realms of safety, equity, and climate change and resilience to increase investment and resources for programs, new and old, that will tackle the challenges of the 21st century in both a national and New Jersey-specific context. Growing awareness of the broad harms of road hazards, inequity and injustice, and climate change will inform not only the purpose of specific program investments but influence transportation planning, project delivery, and research for years to come.

Safety

A major program that will advance safety innovation and renovations across the country is the $5 billion, FY 2022-2026 Safe Streets for All (SS4A) Program. A “Complete Streets” program, SS4A is a discretionary program which seeks to advance USDOT’s goal of zero deaths and serious injuries on our nation’s roadways by implementing multi-modal improvements and safety treatments. Examples of applicable SS4A modifications include separated bicycle lanes, traffic calming road design changes, rumble strips, wider edge lines, flashing beacons, and better signage. Metropolitan planning organizations (MPOs), local, and tribal governments are eligible to apply for this funding. Separate provisions in BIL define Complete Streets standards and policies. Additional information on SS4A can be found here. FHWA provides accessible information on Complete Streets here.

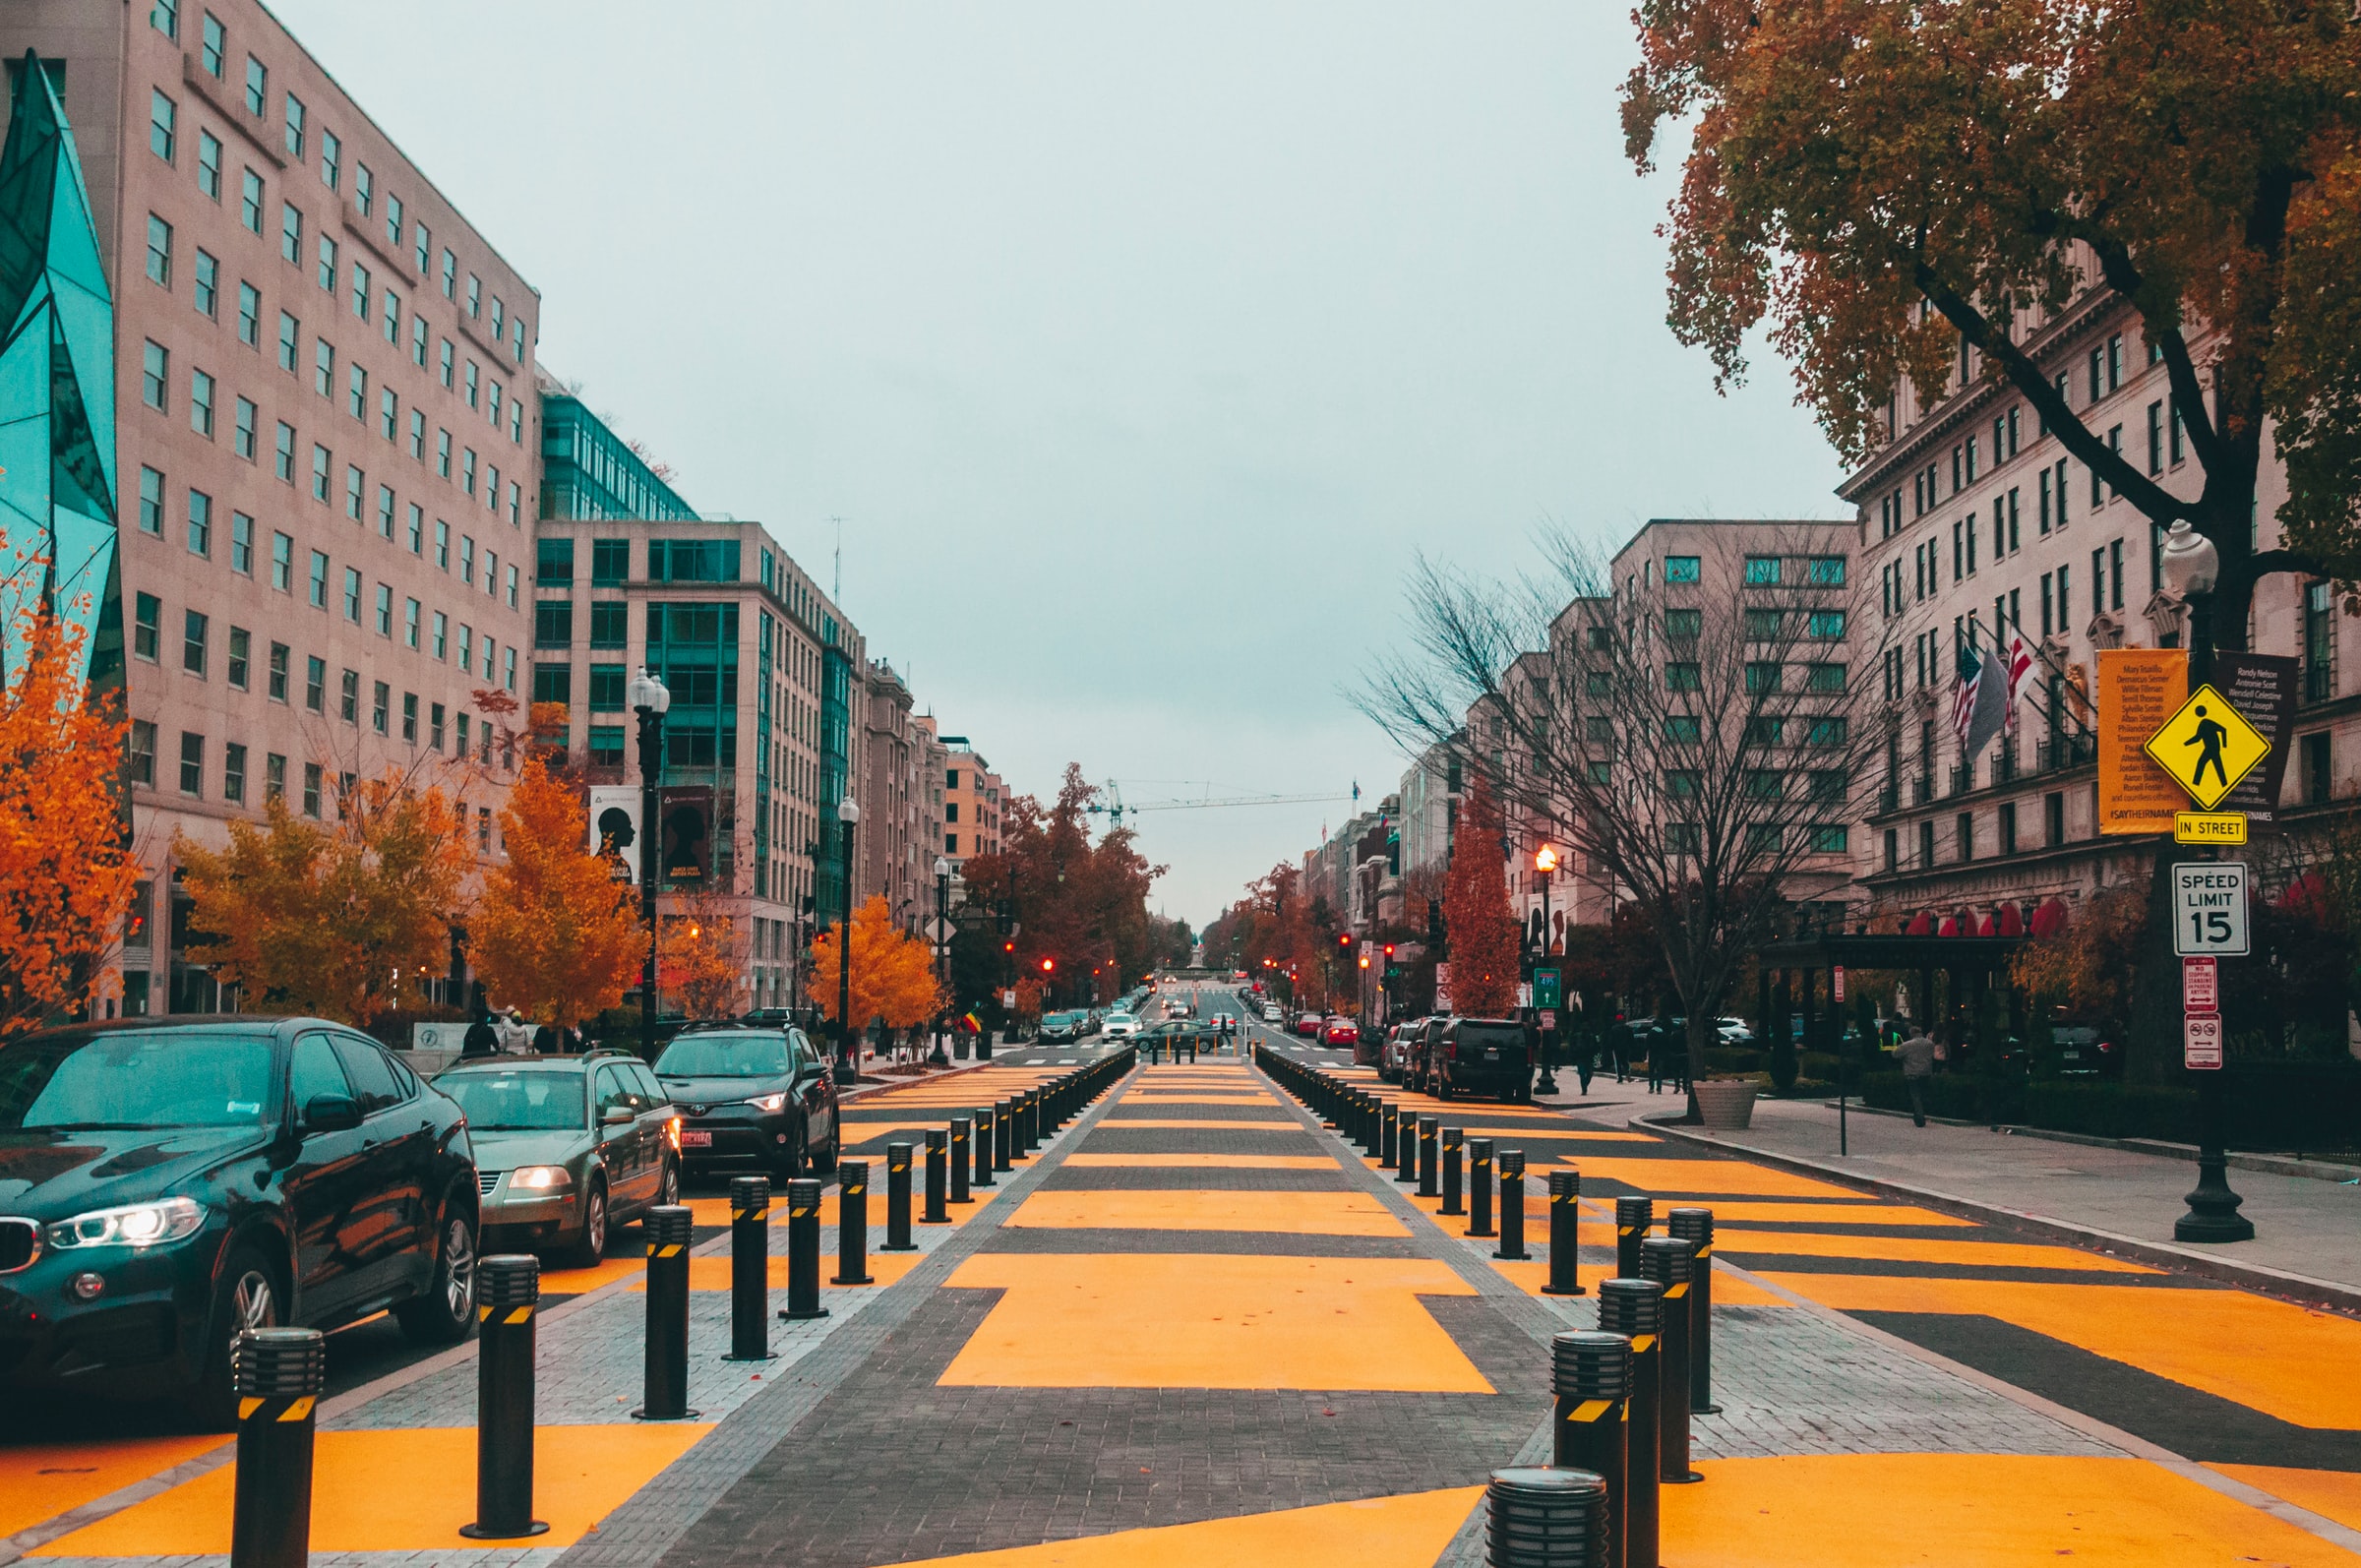
A “complete street” in Washington, D.C. with several community livability features for an urban setting such as wide sidewalks with tree coverage, traffic calming design, and a physically protected middle bike lane.  Photo by Maria Oswalt on Unsplash.

Changes have been made to existing safety programs such as the Highway Safety Improvement Program (HSIP) which could prove to more holistically mitigate road hazards. Eligibility for HSIP’s funds (up to 10 percent) can now be used for “specified safety projects (including non-infrastructure safety projects related to education, research, enforcement, emergency services, and safe routes to school)” [1]. Definitions for the program have been modified to recognize as eligible a variety of new types of projects such as traffic control devices for pedestrians and bicyclists and “roadway improvements that separate motor vehicles from bicycles or pedestrians” [1]. State-level assessments of vulnerable road users are rolled into the requirements of the HSIP. More information on these guidance changes can be found here.

Funding for highway safety traffic programs under the BIL are $13 billion more than the levels established for the Fixing America’s Surface Transportation (FAST) Act. In FY2022-2026, 402 formula funding for highway safety traffic programs is expected to allocate approximately $42 million to New Jersey to help improve driver behavior and reduce deaths and injuries from motor vehicle-related crashes. This funding represents about a 29 percent increase over FAST Act levels [2] when averaged on an annual basis. Such increases in funding for roadway safety improvement provides an opportunity to put forward educational, enforcement and design strategies to counter a recent surge in US and NJ traffic fatalities.

Equity

To promote and implement equity-oriented innovation, the current administration has held itself to a “Justice40 commitment,” the goal of which is to deliver 40 percent of the benefits of the climate and energy related investments to disadvantaged communities [3]. This commitment is reflected in BIL’s transportation funding. One example provided by USDOT is that $5.6 billion in Low- or No-Emission Bus Grants to transition to low- or zero-emission buses will be assessed and likely partially directed to low-income communities to advance environmental justice.

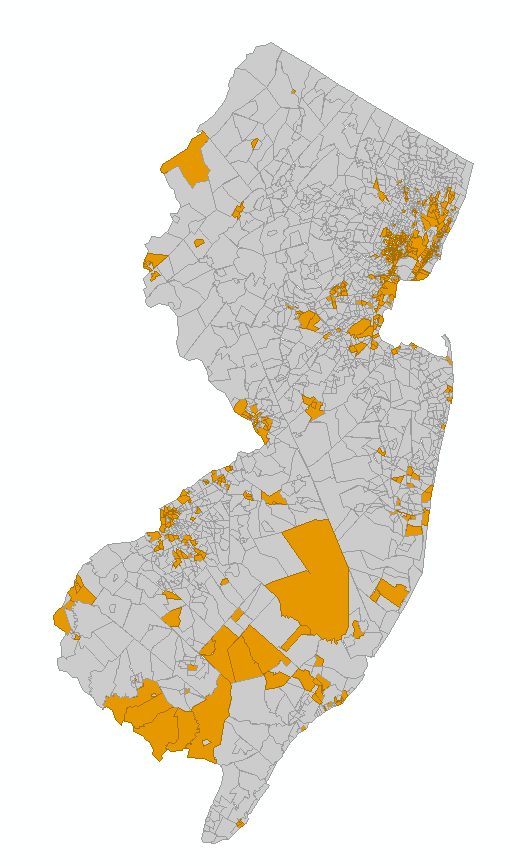
USDOT developed a definition for disadvantaged communities (DACs) to be utilized in connection with certain criteria under Justice40-covered grant programs. The DAC definition draws upon data for 22 indicators collected at the U.S. Census tract level, which are then grouped into six categories of transportation disadvantage to identify places that are disadvantaged.

The Justice40 Disadvantaged Community Interim Definition goes as follows:

  • Transportation access disadvantage identifies communities and places where residents spend more, and take longer, to get where they need to go.
  • Health disadvantage identifies communities based on variables associated with adverse health outcomes, disability, as well as environmental exposures.
  • Environmental disadvantage identifies communities with disproportionately high levels of certain air pollutants and high potential presence of lead-based paint in housing units.
  • Economic disadvantage identifies areas and populations with high poverty, low wealth, lack of local jobs, low homeownership, low educational attainment, and high inequality.
  • Resilience disadvantage identifies communities vulnerable to hazards caused by climate change.
  • Equity disadvantage identifies communities with a high percentile of persons (age 5+) who speak English "less than well."

To assist grant applicants in identifying whether a proposed project is located in a DAC, USDOT provides a list of U.S. Census tracts that meet the DAC definition and a corresponding mapping tool,  Transportation Disadvantaged Census Tracts (Historically Disadvantaged Communities).

Several USDOT programs are using the interim definition of DACs to ask discretionary grant applicants and formula program administrators to identify how their projects benefit DACs. More information on how the Justice40 commitment shapes the equity orientation of BIL’s transportation funding can be found here.

One major new BIL program addressing inequities within America’s transportation infrastructure is the Reconnecting Communities Pilot Program. The discretionary program was conceived to provide $1 billion over five years to remedy the negative effects of past transportation investment decisions that divided communities [1], such as highway expansions that cut cities in half. Applicants for Reconnecting Communities funding can seek capital constructions grants (such as for the replacement of an eligible facility with a new facility that restores community connectivity) or as well as planning grants and technical assistance grants. More information about this innovative program to redress the adverse cumulative effects borne by communities from past transportation investments can be found here.

For New Jersey, the Reduction of Truck Emissions at Port Facilities Program is another innovative program that holds promise for redressing the environmental health effects attributable to siting and operating regional goods movement facilities. By funding the study of, and competitive grants to reduce, truck idling and emissions at ports (such as promotion of port electrification and possibly hydrogen-fuel technologies), pollutants and adverse health disparities borne by port communities could be reduced. Northern New Jersey, as one of the most important freight hubs in North America, is likely to receive some of the $400 million available in discretionary funding (FY2022-FY2026) as well as a portion of the Port Infrastructure Development Program’s annual budget, recently increased to $450 million. These investments to modernize and reduce the environmental burdens of the nation’s freight infrastructure could reduce unfairly distributed health hazards in New Jersey.

In line with the Justice40 commitment, a number of regulatory changes to existing programs contain equity-oriented provisions. In the continuation of the Fixing America's Surface Transportation (FAST) Act, the Metropolitan Planning Program has a BIL requirement “to consider equitable and proportional representation of population of metropolitan planning area when the MPO designates officials or representatives” [1]. Such requirements, even when non-binding, support a wider culture and consideration of equity in how the nation’s urban and transportation policies are devised and implemented. Many communities today live with the legacy of decisions made without their input, and so this innovative provision in the Metropolitan Planning Program is an appropriate step to discontinue such inequities in institutional processes.

USDOT’s Disadvantaged Communities map of New Jersey Census Tracts illustrates several places (in yellow) that should inform project planning that is aligned with the Justice40 Commitment

Climate & Resilience

The climate and resilience orientation of the BIL presents innovation not only in fashioning new programs but in integrating carbon reduction goals into existing infrastructure funding frameworks. The newly established Carbon Reduction Program is a formula-funded $6.4 billion addition to the Highway Trust Fund (HTF) for the purpose of backing projects that reduce transportation emissions, and support development of broader carbon reduction strategies. Projects as varied as congestion pricing systems, infrastructure for alternative fueled vehicles (electric, hydrogen, propane, and natural gas), port electrification, replacement of street lighting and traffic control devices with energy-efficient alternatives, and public transportation are eligible. Additional information on the Carbon Reduction Program can be found here.

Increased need for disaster resiliency in transportation systems informs the purpose of the newly established Promoting Resilient Operations for Transformative Efficient, and Cost-saving Transportation (PROTECT) program. Like the Carbon Reduction Program, PROTECT injects $7.3 billion in the HTF for a formula distribution to the states and also provides $1.4 billion in discretionary funds. This $8.7 billion will help fund resilience improvements in highways, transit systems, intercity passenger rail, and port facilities, as well as support the development of resiliency and evacuation plans. For FY2022 alone, New Jersey is expected to receive roughly $34 million [4] from PROTECT, presenting the opportunity to proactively guard the State’s transportation system from hazards related to climate change. Discussion from the National League of Cities on PROTECT can be found here.

Within the realm of innovative transportation technology, the National Electric Vehicle Infrastructure (NEVI) Formula Program seeks to expand the supply of infrastructure to support the growing presence, if not the transition, of the nation’s fleet to electric and alternative fuel vehicles. Providing approximately $5 billion over five years, NEVI is designed to establish Electric Vehicle (EV) charging stations “along designated Alternative Fuel Corridors, particularly along the Interstate Highway System.” Building on existing federal plans such as Alternative Fuel Corridors, NEVI seeks to guarantee interstate travel by electric vehicle nationally.

Given that New Jersey has the highest number of electric cars per charging station of any state in the country, this additional push is well-suited to the state’s needs and climate goals. The NEVI formula is expected to provide New Jersey with $104.4 million; at an estimated cost per station of $173,000, this level of investment would pay for around 600 charging stations [5]. This funding represents 2.5 percent of the total fund which is roughly commensurate with New Jersey’s Census 2020 population share of 2.8 percent. Another $1.4 billion is available through NEVI discretionary funding that New Jersey could compete to receive.

Similarly, the discretionary Charging and Fueling Infrastructure Program is a competitive funding program with $2.5 billion available to implement innovative fueling infrastructure. At least fifty percent of this funding must be used for a community grant program that prioritizes projects in rural areas, low- and moderate-income communities, and communities with a low ratio of private parking spaces. New Jersey governments’ ability to compete for this funding could shape the built environment and advance the state’s carbon reduction goals for years to come.

Additional information on the National Electric Vehicle Infrastructure Formula Program can be found here. Additional information on how NEVI and the Charging and Fueling Infrastructure program connect within new federal funding programs for EV Charging can found here.  An article of NEVI’s role in New Jersey can found here.

Charging Station sign: Increased investments in EV charging technology will promote changes in built environment and the energy mix of transportation.  Photo by Michael Marais on Unsplash.

Conclusion

These new and innovative programs and provisions of the BiL focus on safety, equity, climate change and resilience topics.  However, the BiL’s highway provisions establish funding and make changes to numerous other programs focused on the nation’s continuing infrastructure, congestion, safety, community, environmental and project delivery challenges. The Congestion Mitigation and Air Quality (CMAQ) Improvement Program, the Surface Transportation Block Grant (STBG) Program, the National Highway Freight Program (NHFP), the Highway System Improvement Program, and the National Highway Performance Program (NHPP) are just some of the existing Federal-aid apportioned programs for which changes in funding, eligible projects, eligible entities and federal shares, among other provisions, are being made.

Other new discretionary programs are established for significant infrastructure programs and freight, equity, planning and project delivery. Research, development, technology and education (RDT&E) program funding levels are authorized with various highway research set-asides established to support deployment and operation of innovative technologies to pilot road usage fees, accelerate digital construction management systems, and advance mobility programs.

The BiL has been characterized as a “once in a generation investment in infrastructure.”  As with prior Federal transportation spending bills, the BiL contains provisions that can be expected to influence the nation’s economic competitiveness, environmental sustainability and development priorities. In this case, the BiL offers new opportunities for planning, building, and maintaining a transportation system that is more reliable and safe, equitable, and resilient to economic and energy security challenges and climate change. 

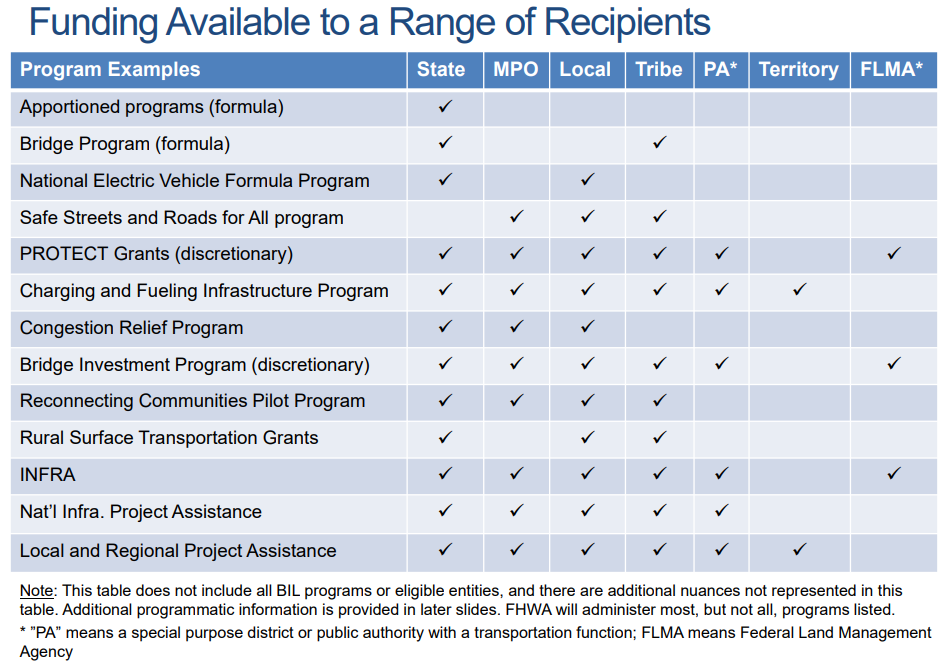
FHWA has prepared a table to illustrate how various programs are available to a range of recipients . Interestingly, Safe Streets and Roads for All is the only program that states are not eligible for, conveying a truly neighborhood scale approach.
FHWA has prepared a table to illustrate how various programs are available to a range of recipients. Interestingly, Safe Streets and Roads for All is the only program that states are not eligible for, conveying a truly neighborhood scale approach.


RESOURCES

Referenced Resources:

[1] Bipartisan Infrastructure Law (BIL) * Overview of Highway Provisions file
[2] The Bipartisan Infrastructure Law Will Deliver for New Jersey https://www.transportation.gov/briefing-room/bipartisan-infrastructure-law-will-deliver-new-jersey
[3] Justice40 Initiative https://www.transportation.gov/equity-Justice40
[4] Distribution of Promoting Resilient Operations for the Transformative, Efficient, and Cost-Saving Transportation (PROTECT) Program Funds Apportioned for Fiscal Year 2022 https://www.fhwa.dot.gov/legsregs/directives/notices/n4510864/n4510864_t20.cfm
[5] NJ will receive $15.4 million to expand electric vehicle charging infrastructure this year https://dailytargum.com/article/2022/02/nj-will-receive-usd15-4-million-to-expand-electric-vehicle-charging

Other Resources Highlighted:

Next-Generation TIM: Integrating Technology, Data, and Training

What is Next-Generation TIM: Integrating Technology, Data, and Training?

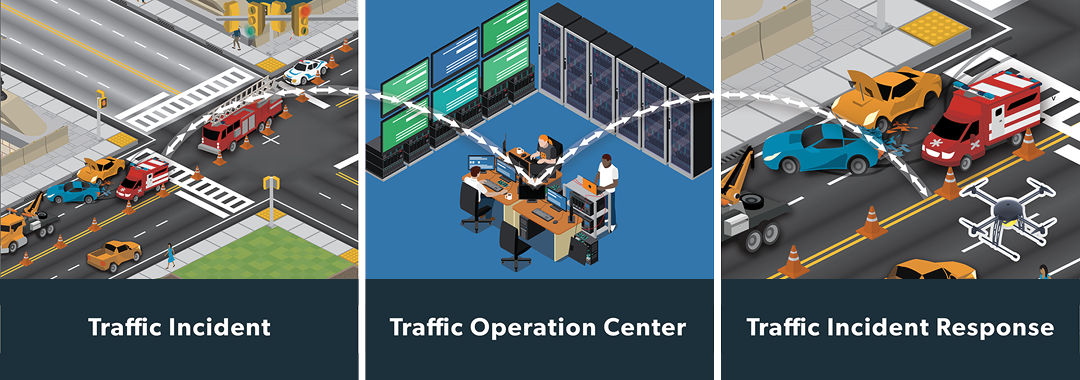
New methods for improving Traffic Incident Management (TIM) programs aim to increase traveler and responder safety and improve trip reliability and commerce movement on all roadways.

Over 6 million reportable crashes occur every year in the United States. Each crash places responders and motorists at risk of secondary crashes while having a severe impact on congestion. New tools, data, and training mechanisms can be used to improve safety and reduce clearance times at roadway crashes. New and existing TIM programs, including those for local agencies and off-interstate applications, will benefit from using enhanced TIM practices on all roadways to save lives, time, and money.

A New Generation of TIM

While the FHWA's national TIM responder training program successfully trained almost 500,000 responders to clear incidents collaboratively, safely, and quickly, it was largely focused on agencies that respond on interstates and high-speed roadways. Next-generation (NextGen) TIM increases the focus on local agency TIM programs while integrating new and emerging technology, tools, and training to improve incident detection and reduce safety response and clearance times on all roadways.

Traditionally, transportation agencies capture incidents (crashes, roadway debris, stalled vehicles on mainlines, etc.) where sensor technologies are installed, where safety service patrols are present, or when contacted by public safety/law enforcement agencies. NextGen TIM significantly expands this capacity. It enables agencies to improve TIM strategies by implementing new options such as back-of-queue warning, navigation-app notification of active responders in the vicinity, notification-based incident detection using crowdsourced data, and more.

By using NextGen TIM methods, State and local agencies can increase traveler and responder safety, improve trip reliability and commerce movement, and enable responder communities to focus more resources on other pressing citizen needs.

Benefits

Increased Safety. NextGen TIM targets advances in safety through engineering, enforcement, education, and emergency services to help keep responders, drivers, and pedestrians safe across freeway, arterial, and multimodal travel.

Improved Travel Times. Training, data, and technology combine to help local and State agencies reduce secondary crashes and clearance times, improving trip reliability and increasing motorists' awareness of active responders along their travel routes.

Improved Operations. Integrating new and emerging technology, tools, and training can improve incident mitigation and safety throughout the whole TIM timeline, from incident detection to clearance on all roadways.

Learn more about this EDC-6 Innovation.

How NJ Incorporates NextGen Traffic Incident Management (TIM)

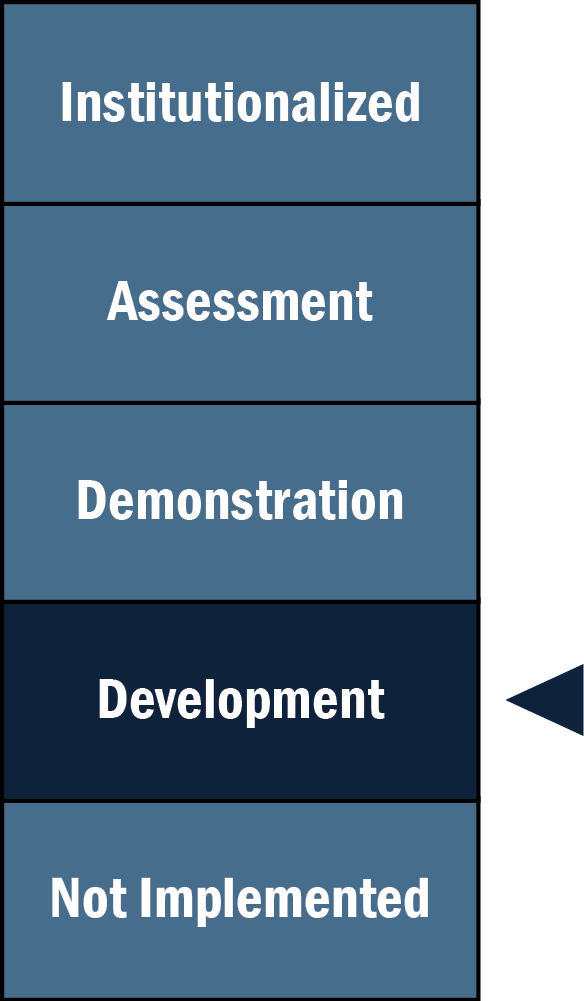
Stage of Innovation:
DEVELOPMENT
(December 2022)

Research. NJDOT is coordinating with State Police to determine communications that will be shared with Computer-Aided Dispatch (CAD) integration. NJDOT is also working to establish radio channels to enable coordinated DOT and law enforcement communications at incident sites.

Training. NJDOT is actively working towards achieving participation by all local agencies in the NJDOT established statewide TIM training course.

Building Support. DVRPC area-generated incident management task forces can serve as models for creation of similar diverse stakeholder task forces in other regions. NJDOT is also looking to build partnerships with media to facilitate TIM communications.

What’s Next?

For the EDC-6 initiative, the NJDOT initially wanted to focus on CAD integration as one of the major activities in support of the TIM strategic plan. As a result of NJ State Police's decision to change their CAD technology, the NJDOT is revising their approach for EDC-6 NextGen TIM.

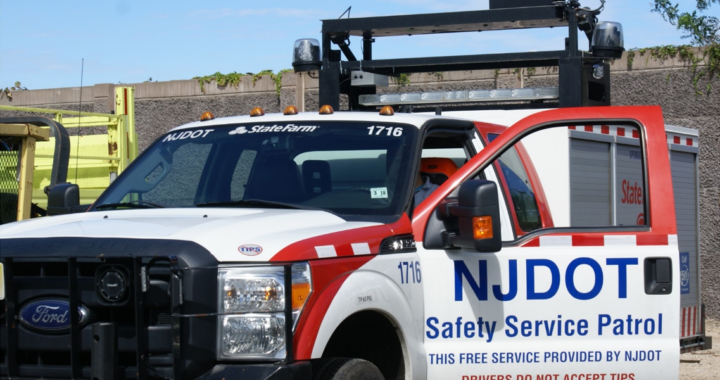
NJDOT is continuing to coordinate with the NJIT ITS Resource Center to deploy HAAS Alert technology on NJDOT's Safety Service Patrol vehicles. The responder-to-vehicle alert application will deliver incident alerts to the motorists (i.e. phone apps) for their situational awareness when approaching a stopped SSP vehicle assisting stranded motorists to assist in reducing speed and collision.

The NJSP statewide CAD system (Motorola FLEX) is currently being re-evaluated. The NJDOT will continue to maintain the existing working group/team comprising staff from the Mobility Operations, Mobility Planning/Research, and NJIT ITS Resource Center to provide coordination and strategic planning for the CAD integration project.


Next-Generation TIM: Integrating Technology, Data, and Training: NEW & NOTEWORTHY

NJDOT Traffic Incident Management Training Course – Now Available Online as Self-Guided Course

NJDOT Traffic Incident Management Training Course – Now Available Online as Self-Guided Course

NJDOT's Traffic Incident Management training is now available as an online, self-guided course. Bringing first responder training program to online platform should make it ...
Talking TIM Webinar Series (TIM) Webinar Series

Talking TIM Webinar Series (TIM) Webinar Series

A series of FHWA-hosted webinars spotlights ongoing NextGen TIM implementations and best practices. ...
Innovation Spotlight: Testing and Deploying ITS Solutions for Safer Mobility and Operations

Innovation Spotlight: Testing and Deploying ITS Solutions for Safer Mobility and Operations

We spoke with Sue Catlett from NJDOT's Transportation Mobility, Planning and Research Group to get an update on Crowdsourcing, Weather Responsive Management and Traffic Incident ...
Developing Next Generation Traffic Incident Management in the Delaware Valley

Developing Next Generation Traffic Incident Management in the Delaware Valley

DVRPC's Traffic Incident Monitoring (TIM) platform provides system-wide traffic operators, first responders, and highway planners. ...
Final Report Released for the Connected Vehicles Program Pilot Testing of Technology for Distributing Road Service Safety Messages from Safety Service Patrols

Final Report Released for the Connected Vehicles Program Pilot Testing of Technology for Distributing Road Service Safety Messages from Safety Service Patrols

NJDOT’s top priority is to improve highway safety. To support this goal, in September 2018, New Jersey began a pilot study of the effectiveness of ...
Connected Vehicles Program Pilot Testing of Technology for Safety Service Patrol Workers Continues

Connected Vehicles Program Pilot Testing of Technology for Safety Service Patrol Workers Continues

The pilot study continues to examine the effectiveness of connected vehicle technology to alert motorists to Safety Service Patrol (SSP) workers at an incident site. ...
New Jersey Pilots Connected Vehicles Program  to Protect Safety Service Patrol Staff

New Jersey Pilots Connected Vehicles Program to Protect Safety Service Patrol Staff

This study will examine the effectiveness of connected vehicle technology to alert motorists to Safety Service Patrol (SSP) workers at an incident site. ...

Reducing Rural Roadway Departures

What is Reducing Rural Roadway Departures?

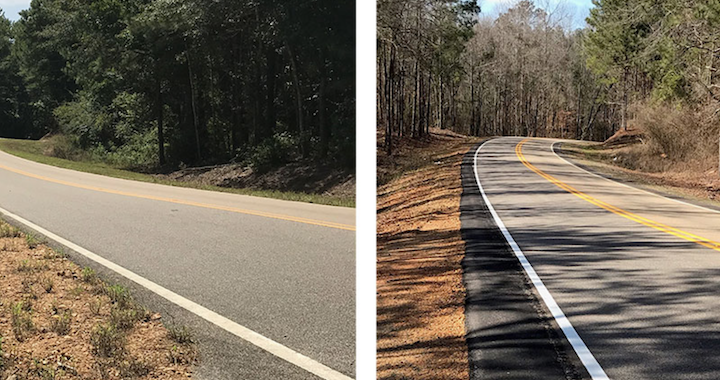
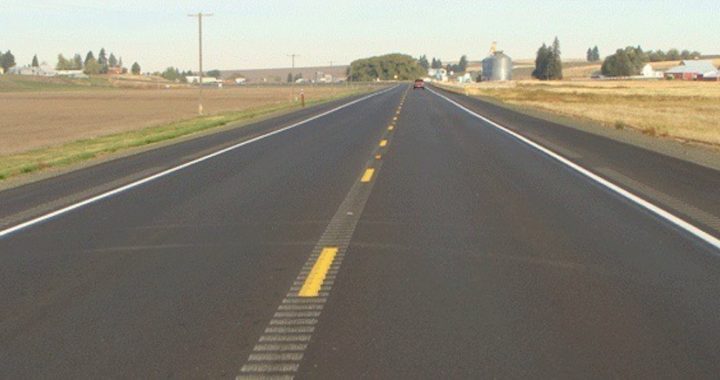
Reducing fatalities on rural roads remains a major challenge in the United States. Roadway departures on the rural road network account for one-third of traffic fatalities. Systemic application of proven roadway departure countermeasures, such as rumble strips, friction treatments, and clear zones, helps keep vehicles in their travel lanes, reduce the potential for crashes, and reduce the severity of those crashes that do occur.

Data-driven systemic analysis can help agencies prioritize the locations and countermeasures that will be most effective by taking a broad view to evaluate risks across an entire roadway system. It can be used to proactively implement countermeasures where crashes are likely to happen, even for locations where no crashes have been recorded. The benefits include safer roads, quick deployment, and flexibility.

Learn more about this EDC-5 Innovation.

NJ Expands Systemic Application of Proven Safety Countermeasures

Stage of Innovation:
DEVELOPMENT
(January 2021)

With EDC-5, NJ plans to expand their current practices to reduce rural roadway departures:

Utilizes Crash Data for Proactive Systemic Approach. Currently, NJ uses crash data to analyze transportation systems for all public roads and applies a proactive systemic approach including rumble striping, low-cost countermeasure mitigation, high friction surface treatments, and signage improvements, unless a location is on the high crash list. Then NJ provides project-specific mitigation to reduce or eliminate the issue. NJ implements these approaches on rural roads through the Local Safety, High Risk Rural Roads, and Preliminary Engineering and Design Assistance Programs.

What's Next?

Be Proactive and Organize Workshops. The FHWA Resource Center conducted a Train-the-Trainer Workshop at NJDOT Headquarters in June 2019.  Training events, hosted by the state's MPOs, were being planned for safety professionals, rural roadway facility owners and maintainers on roadway departures, location identification, systemic approach to safety, and proven safety countermeasures, with the assistance of the FHWA Safety Program Office and the FHWA Resource Center.

The planned in-person workshops were cancelled due to COVID restrictions and CDC/State guidelines. Instead NJDOT and FHWA plan to host virtual training sessions presented by the FHWA Resource Center, tentatively scheduled for March 2021.

Reducing Rural Roadway Departures: NEW & NOTEWORTHY 

Focus on Reducing Rural Roadway Departures (FoRRRwD): Webinar Series

Focus on Reducing Rural Roadway Departures (FoRRRwD): Webinar Series

The FHWA Focus on Reducing Rural Roadway Departures (FoRRRwD) initiative, part of EDC-5, looks to provide systematic, targeted solutions for implementing rural road safety measures. ...
Reducing Rural Road Departures: Upcoming FHWA Webinar and Other Resources Advance EDC-5 Initiative

Reducing Rural Road Departures: Upcoming FHWA Webinar and Other Resources Advance EDC-5 Initiative

On May 12, the FHWA will host FoRRRwD on All Public Roads: Innovative Mechanisms to Deliver Safety Projects, the second of its monthly webinars designed ...
How New Jersey Counties are Reducing Rural Roadway Departures

How New Jersey Counties are Reducing Rural Roadway Departures

Reducing fatalities on rural roads is a key challenge for transportation agencies in the United States, where roadway departures on rural networks account for one-third ...
Focusing on Reducing Rural Road Departures (Video)

Focusing on Reducing Rural Road Departures (Video)

Pavement preservation is just one example among many of how NJDOT is committed to keeping New Jersey’s roadways in a state of good repair and ...

Safe Transportation for Every Pedestrian (STEP)

What is Safe Transportation for Every Pedestrian (STEP)?

Pedestrians account for over 17.5 percent of all fatalities in motor vehicle traffic crashes, and the majority of these deaths occur at uncontrolled crossing locations (such as non-intersections) or at intersections with no traffic signal or STOP sign. Cost-effective countermeasures with known safety benefits can help reduce pedestrian fatalities in these scenarios.

FHWA promoted the following safety countermeasures through EDC-4 and EDC-5:

Road Diets can reduce vehicle speeds, limit the number of lanes pedestrians cross, and create space to add new pedestrian facilities.

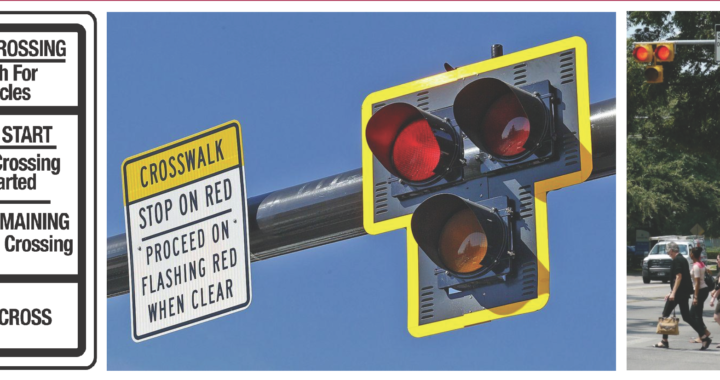
Pedestrian Hybrid Beacons (PHBs) are a beneficial intermediate option between Rectangular Rapid Flash Beacons (RRFBs) and a full pedestrian signal. They provide positive stop control in areas without the high pedestrian traffic volumes that typically warrant signal installation.

Pedestrian Refuge Islands provide a safe place to stop at the midpoint of the roadway before crossing the remaining distance. This is particularly helpful for older pedestrians or others with limited mobility.

Raised Crosswalks can reduce vehicle speeds.

Crosswalk Visibility Enhancements, such as crosswalk lighting and enhanced signing and marking, help drivers detect pedestrians—particularly at night.

Learn more about this EDC-4 and EDC-5 Innovation.

NJ's Progress Towards Institutionalizing STEP

Stage of Innovation:
INSTITUTIONALIZED
(January 2021)

NJ's work on STEP began with EDC-4 and continued to progress during EDC-5:

Developed an Action Plan for Implementing Pedestrian Crossing Countermeasures at Uncontrolled Locations. For this collaborative effort, NJDOT and FHWA reviewed existing practice and policies impacting crossings and recommended actions for targeting specific safety countermeasures to help reduce the number and rate of pedestrian crashes, fatalities, and injuries on NJ highways.

Devised Recommendations Following STEP Guidance for Implementing Lower-Cost Countermeasures. The recommended countermeasures can be deployed based on specific needs, have a proven record of reducing crashes, and represent underutilized innovations that can have an immediate impact.

Developed NJ 2020 Strategic Highway Safety Plan. STEP strategies have been included in the 2020 NJ Strategic Highway Safety Plan update, completed in August 2020 and implementation efforts of proposed actions items are underway.

What's Next?

New Jersey has developed strategies in the 2020 Strategic Highway Safety Plan and will implement these strategies with the goal of eliminating all pedestrian and bicyclist fatalities and serious injuries on all public roads.

Click for the STEP Fact Sheet.

SAFE TRANSPORTATION FOR EVERY PEDESTRIAN (STEP): NEW & NOTEWORTHY 

ATLANTIC AVENUE, ATLANTIC CITY: Planning for Safer Conditions for All Roadway Users

ATLANTIC AVENUE, ATLANTIC CITY: Planning for Safer Conditions for All Roadway Users

Following a decade of transportation planning studies, including a Road Safety Audit (RSA), pedestrian and cyclist improvements are being programmed for Atlantic City's Atlantic ...
Research Spotlight: Evaluating the Pedestrian Hybrid Beacon’s Effectiveness:  A Case Study in New Jersey

Research Spotlight: Evaluating the Pedestrian Hybrid Beacon’s Effectiveness:  A Case Study in New Jersey

Pedestrian Hybrid Beacons, one of FHWA’s seven Safe Transportation for Every Pedestrian (STEP) countermeasures, proven methods of reducing pedestrian collisions, are the subject of a ...
STEP-Aligned HAWK Signal Installed in Bergen County

STEP-Aligned HAWK Signal Installed in Bergen County

EDC STEP-aligned projects have been successfully deployed in locations across New Jersey, including a recent pedestrian improvement project along Washington Avenue in the Borough of ...
TECH TALK! Webinar: EDC Safe Transportation for Every Pedestrian

TECH TALK! Webinar: EDC Safe Transportation for Every Pedestrian

Please join the NJDOT Bureau of Research on April 2nd for an Innovation Exchange Webinar, EDC Safe Transportation for Every Pedestrian (STEP), that we are ...
NJLTAP – Proven Safety Countermeasures Workshops – Upcoming Events

NJLTAP – Proven Safety Countermeasures Workshops – Upcoming Events

The New Jersey Local Technical Assistance Program (NJLTAP) has partnered with the FHWA Division Office, NJDOT Bureau of Safety, Bicycle and Pedestrian Programs and Local ...
EDC-5 STEP – Safe Transportation for Every Pedestrian

EDC-5 STEP – Safe Transportation for Every Pedestrian

On October 30th the NJDOT Bureau of Research hosted the Lunchtime Tech Talk! Event on EDC-5 STEP: Safe Transportation for Every Pedestrian. ...
NJDOT Safety Countermeasures Training and Education Videos

NJDOT Safety Countermeasures Training and Education Videos

The following videos describe six of FHWA’s Proven Safety Countermeasures that improve pedestrian safety. NJDOT developed these videos to train and educate viewers on the ...
NJLTAP – Safe Transportation for Every Pedestrian Workshop

NJLTAP – Safe Transportation for Every Pedestrian Workshop

The NJ Local Technical Assistance Program is holding an all-day workshop training event to learn more about the FHWA EDC-5 innovative initiative: Safe Transportation for ...
Local Safety Peer Exchanges: Summary Report

Local Safety Peer Exchanges: Summary Report

The Local Safety Peer Exchange Summary Report describes a series of peer exchange events that highlighted local initiatives that demonstrate best practice in addressing traffic ...
Local Peer Safety Exchange – 3rd Event

Local Peer Safety Exchange – 3rd Event

The third event in the series to discuss local initiatives that demonstrate best practice in addressing traffic safety was held on March 26, 2019. ...
New Jersey To Expand Data-Driven Approach to Highway Safety Management

New Jersey To Expand Data-Driven Approach to Highway Safety Management

Aided by STIC funding, NJDOT pilots a sofware package to proactively identify sites for safety improvement. ...
Local Safety Peer Exchange – 2nd Event

Local Safety Peer Exchange – 2nd Event

The second event in the series to discuss local initiatives that demonstrate best practice in addressing traffic safety was held on June 13th. ...
Road Diets Are Making Roads Safer in New Jersey

Road Diets Are Making Roads Safer in New Jersey

FHWA recognizes road diets as one of 20 “Proven Safety Countermeasures” to reduce serious injuries and fatalities on American highways and roads. ...
Local Safety Peer Exchange – 1st Event

Local Safety Peer Exchange – 1st Event

The first event in the series to discuss local initiatives that demonstrate best practice in addressing traffic safety was held on December 6th. ...

How New Jersey Counties are Reducing Rural Roadway Departures

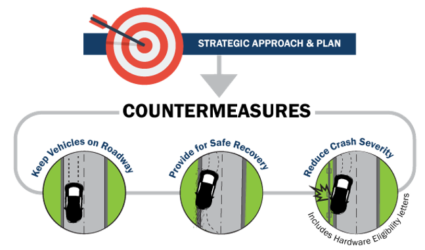
Reducing fatalities on rural roads is a key challenge for transportation agencies in the United States, where roadway departures on rural networks account for one-third of traffic fatalities. The Federal Highway Administration (FHWA) has identified safety countermeasures that are proven to improve rural roadway safety and reduce the number of traffic deaths. In the fifth round of the agency’s Every Day Counts (EDC) State-based model, FHWA identified “Reducing Rural Roadway Departures” as a proven, yet underutilized, innovation. The four pillars of the initiative are: all public roads, proven countermeasures, a systemic approach, and safety action plans. FHWA Proven Safety Countermeasures for rural roadway departures fall into three broad categories: helping drivers stay in their lane, reducing the risk of a crash with lane departures, and minimizing the severity in the case of a crash. Specifically, FHWA safety countermeasures related to rural roadway departures include rumble strips and stripes, SafetyEdgeSM, high friction surface treatment, and backplates with retroreflective borders. A recent FHWA video, Focusing on Reducing Rural Road Departures, provides information on how these low-cost measures help drivers stay in their travel lanes and reduce the potential, or minimize the severity, of rural roadway crashes.

Through EDC, FHWA seeks to support rapid deployment of identified initiatives at the State and local level, which results in cost, time, and resource savings. As of December 2019, New Jersey is in the “development” phase of the Reducing Rural Roadway Departures initiative; NJDOT is collecting guidance and best practices, while building support with partners and stakeholders to develop an implementation process. The goal is to reach the “demonstration” stage by the end of EDC-5 (December 2020), when they would begin testing and piloting the innovation.

In order to achieve this goal, NJDOT seeks to improve the knowledge of rural roadway facility owners and maintainers through training, with the assistance of the FHWA Resource Center. In 2018 and 2019, FHWA and NJDOT hosted a series of Local Safety Peer Exchanges at which engineering staff from Cumberland and Somerset counties shared their experience with implementation of countermeasures on high risk rural roads (HRRR).

FHWA’s Strategic Approach and Plan to reduce roadway departure crashes and fatalities. Photo Source: FHWA, 2019.

The Cumberland County Engineering Office manages infrastructure that includes 540 miles of county roads, 50 traffic signals and flashers, 54 bridges, and 169 minor bridges. One important source of funding for their work is the Highway Safety Improvement Federal-aid Program (HSIP). The purpose of HSIP is to achieve a significant reduction in highway fatalities and serious injuries on all public roads, using a data-driven, strategic approach focused on improving performance. The County focuses on two types of projects for HSIP: systemic projects and “hot-spot” projects. Systemic projects apply a given improvement method over a large number of applicable locations in order to deter “random” crash events and reduce risk across an entire roadway system.

Hot-spot projects need more in-depth data collection and analysis to determine appropriate site-specific improvements related to crash history. To collect data for hot-spot projects, South Jersey Transportation Planning Organization (SJTPO), the regional Metropolitan Planning Organization (MPO) for Cumberland County, worked with Rutgers University’s Center for Advanced Infrastructure and Transportation (CAIT) to use NJDOT’s Plan4Safety multi-layered decision support tool to create four network screening lists for the region. Each list provided weighted scores for a given timeframe based on a location’s number and severity of crashes. The four screening lists identify pedestrian intersection hot spots, pedestrian corridor hot spots, intersection hot spots, and HRRR hot spots.

Selecting the appropriate countermeasure is critical to project success. When using network screening lists, the countermeasure should address the particular type of crash occurring at the location, while countermeasures used with the systemic approach should address the specific geometric trait(s) that are related to the specific crash type.

Cumberland County highlighted two countermeasures at the Peer Exchange: centerline rumble strips and high friction surface treatment on horizontal curves. Centerline rumble strips reduce the risk of cross centerline crashes and are often part of a systemic approach. With the help of NJDOT’s Bureau of Transportation Data and Safety, SJTPO created a candidate list of potential centerline rumble strip locations. NJDOT’s criteria limit installation to two-lane urban or rural roadways with a 20-foot minimum pavement width, and a speed limit of 35 mph or greater. In addition, Cumberland County limited installation to asphalt roadways 10 years old or less in less dense residential neighborhoods due to the noise the rumble strips produce. Based on these criteria, the County selected approximately 150 roadway miles across 11 municipalities. Installation was performed at night to lessen the impact on traffic, improve safety conditions for construction workers and inspectors, and shorten installation time.

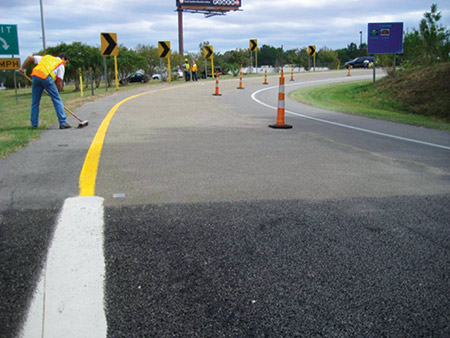
HFST installation at a horizontal curve. Photo Source: FHWA, 2018.

The second method, high friction surface treatment (HFST) on horizontal curves, addresses the challenges that horizontal curves pose due to the change in alignment that can cause issues for driver navigation, especially at night or in inclement weather. According to data analysis cited by SJTPO, 28 percent of fatal crashes nationwide occur on horizontal curves. HFST compensates for the high friction demand at the curves in areas where the current pavement condition does not adequately support operation speed, due to a number of factors such as sharp curves, wet conditions, polished roadway surfaces, inadequate cross-slope design, and driving speeds above the curve advisory speed. HFST are proven to reduce wet road crashes by 52 percent and curve crashes by 24 percent according to the FHWA. Additionally, these treatments are safe for all vehicle types and have high durability. However, the county engineer also noted the high unit cost and the lack of contractors within the region capable of HFST installation. When properly installed, the pavement life is equal to, our greater than, asphalt pavement but improper installation potentially limits the usefulness and life expectancy of the pavement treatment.

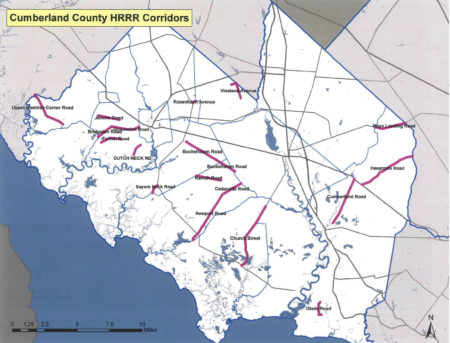
Locations were selected from the HRRR list, along with spots familiar to the Engineering Department based on geometry, crash history, residential input, and municipality information. Additionally, pavement condition was taken into consideration as a factor that could affect the treatment’s durability.

Cumberland County staff highlighted the importance of updating and upgrading existing safety features during the project such as size, location, spacing, and retroreflectivity of signage. They noted important considerations moving forward: data used in the network screening lists is aging; the rumble strip projects had a long delivery timeline of 22 months from application submission to construction notice to proceed; and the centralized project review process eliminated interactions with the local public agency which tends to have the most detailed knowledge of the project area.

Cumberland County High Risk Rural Roads Locations in Cumberland County. Photo Source: Whitaker, 2018.

A representative of the Somerset County Engineering Office shared their systemic safety approach to horizontal curves with high friction surface treatment. The Engineering Office manages infrastructure for 250 miles of county roads, 193 traffic signals, and 762 bridges, along with county sites, facilities, and parks. Annually, their work includes 15 miles of road resurfacing, 1.2 miles of road reconstruction, 7 bridge replacements, installation or upgrade of 10 traffic signals, and replacing more that 150 ADA curb ramps. The catalyst to pursue pavement friction treatments was the availability of crash data from the Plan4Safety crash database, which allowed Somerset County and their MPO, North Jersey Transportation Planning Authority (NJTPA), to analyze crash trends in the region in order to plan for infrastructure improvements based on need and types of issues.

Based on this analysis, the county identified and prioritized horizontal curves where they decided pavement friction treatments would be the best countermeasure. The next questions they had were: what is the correct treatment method; when is treatment appropriate; and how do they determine the length of need on the horizontal curve. Initially, the county used micro milling which provides a high friction surface to reduce “run-off’ road crashes for a low cost of installation. Downsides for the treatment include a short life expectancy, complaints from motorcyclists and bicyclists, and negative public perception associated with milling a newly paved surface.

Based on this experience, the county turned next to high friction surface treatment as an option that is safe for all vehicle types and has a longer life expectancy than micro milling. As did Cumberland County, Somerset County noted the treatment’s high cost at $35-65 per square yard and the specialized nature of the installation. Somerset County’s evaluation method for determining when HFST should be used requires the following data: centerline alignment geometry, roadway cross slope, road profile slope, posted speed limit, and posted curve advisory plate speed. The resulting evaluation produces friction ranges to guide the action taken.

Initial micro milling treatment in Somerset County. Photo Source: Bates Smith, 2017.

Somerset County found a comparison of crashes in the years prior to the treatment with crash data from the year after the treatment revealed a significant reduction in crashes, although they cautioned that there may be other factors at play. In the case of Chimney Rock Road, annual crashes dropped 84 percent from 73 to 12 for the year after HFST was applied to 5 curves on a 1-mile road segment. Looking to the future, the county plans to prioritize high crash locations for evaluation to either implement additional signage or HFST, based on data from GIS crash mapping, along with the NJ Regional Curve Inventory and Safety Assessment for the NJTPA region. They additionally highlighted important resources that have emerged, including the FHWA’s HFST Curve Selection and Installation Guide.

Cumberland and Somerset counties are just two examples of rural roadway departure safety improvements happening around the state. In the NJTPA region, Monmouth County received $2,967,000 from NJTPA’s FY 2017-18 High Risk Rural Roads (HRRR) Program for corridor improvements on Stage Coach Road in Upper Freehold Township, including the application of high friction surface treatment, safety edging, and centerline rumble strips. To help support and expand these efforts, NJDOT will be holding train-the-trainer events at DVRPC, SJTPO, and NJTPA later this year for county and municipal representatives, MPO staff, and NJDOT staff. This training will help New Jersey advance to the next stage of this EDC-5 initiative and improve safety on rural roads throughout the State.

Featured Image Source: FHWA, 2016.

Resources

Bates Smith, P. (2019). Pavement Friction Surface Treatments. Retrieved from https://www.njdottechtransfer.net/wp-content/uploads/2019/04/E_Somerset-PAVEMENT-FRICTION-surface-treatments-3-21-19.pdf

FHWA. (2019). Reducing Rural Roadway Departures. Retrieved from https://www.fhwa.dot.gov/innovation/everydaycounts/edc_5/roadway_departures.cfm

FHWA. (2020). Proven Safety Countermeasures. Retrieved from https://safety.fhwa.dot.gov/provencountermeasures/

FHWA. Focus on Reducing Rural Roadway Departures (FoRRRwD) Overview Video. (2019). Retrieved from https://www.youtube.com/watch?v=WfdBrrl0WwU&t=87s

NJTPA. (2020). Local Safety Program/High Risk Rural Roads. Retrieved from https://www.njtpa.org/localsafety.aspx

SJTPO. (2020). Highway Safety Improvement Program – Safety Infrastructure. Retrieved from https://www.sjtpo.org/hsip/

Whitaker, D. W. (2018). Systemic Safety Improvements. Retrieved from https://www.njdottechtransfer.net/wp-content/uploads/2018/06/Cumberland-Systemic.pdf

Final Report Released for the Connected Vehicles Program Pilot Testing of Technology for Distributing Road Service Safety Messages from Safety Service Patrols

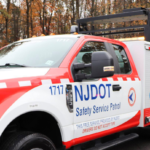
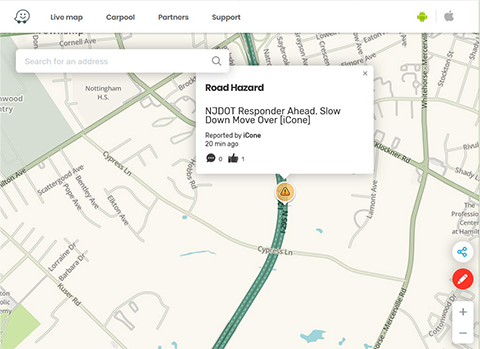
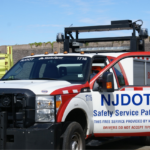
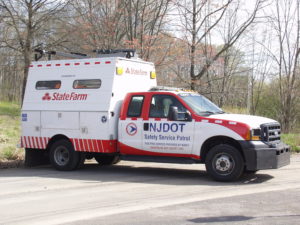
NJDOT’s top priority is to improve highway safety. To support this goal, in September 2018, New Jersey began a pilot study of the effectiveness of using connected vehicle technology to alert the motoring public to the presence of safety service patrol (SSP) workers at incident sites.  With the support of the NJ State Innovation Council (NJ STIC) and a STIC Incentive Funding grant of $39,600 awarded by FHWA, NJDOT piloted the use of Beacon Hazard Lights technology on 32 safety service vehicles to alert drivers to the presence of workers via the mobile navigation app Waze. The device, which is produced by iCone, uses GPS location and wireless communication technology to transmit the location of the SSP vehicles to the iCone Data Server in the cloud where it can be picked up by Waze. Together with the New Jersey Institute of Technology’s (NJIT) ITS Resource Center, NJDOT published a final report of their findings from the pilot project in December 2019, available here.

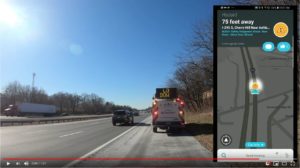
The SSP location and message shown on the Waze.com website. Photo Source: Cowan et al., 2019.

The primary goal of the study was to test the feasibility of the iCone technology on SSP vehicles by analyzing the time elapsed between device activation and Waze notification, to examine the Verizon 4G cellular network strength for potential coverage loss that could result in service disruption in communication, and to analyze the effectiveness of the equipment through several testing means. The methods of evaluation to complete these objectives were field and remote testing of the technology and documentation of the equipment installation and repairs. Field testing was conducted from January to October 2019 by activating the iCone-enabled SSP truck hazard lights and Dynamic Message Board (DMS) at 2-mile intervals along the entire 280-mile SSP coverage area. An analyst conducted remote testing through monitoring of the iCone and Waze web-based interfaces.

The results of field testing showed that, on average, communication with Waze was successful 76 percent of the time, 20 percent of the time the device communicated with the iCone Data Server but not Waze, and the remaining 4 percent of the time the device did not transmit its location to the iCone Data Server or Waze. The average time elapsed from the iCone device activation to its appearance in Waze was 2 minutes and 41 seconds. On two days of testing along the SSP coverage area, there was no communication between the iCone device and iCone Data Server or Waze.

In addition to field testing, analysts conducted remote testing of 85 active instances of the iCone device by observing the iCone and Waze web portals. In 59 percent of these 85 instances, the active iCone device was detected in Waze, with 29 percent of these successful detections showing the exact timestamp in both Waze and iCone. These results were shared with Waze so that the company could address the issues related to missing and delayed data transmission. For equipment evaluation, results showed that by April 2019, 12 of the units had technical problems that were attributed to the winter weather conditions in New Jersey including snow, road salt, and extreme cold. The iCone engineering team was responsive to the issues and re-evaluated the device design so that replaced units could withstand the weather conditions. A prototype of the newly-designed replacement devices was delivered to NJDOT in December 2019 and has been installed in five of the vehicles.

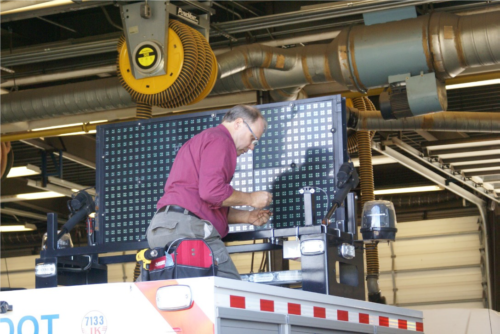
The installation of the device on an SSP vehicle by an iCone technician. Photo Source: Cowan et al., 2019.

The researchers believe that this technology evaluation pilot project was the first of any state DOT to seek to inform the public of SSP patrol vehicle locations with the sole objective of increasing safety.  The pilot project provided valuable analysis and lessons learned to inform next steps for NJDOT. Testing and analysis of installed devices and their replacements will continue until the end of the product warranty period on September 1, 2021. Additionally, researchers recommended further investigation of the disruptions and delays in the communication path from the iCone device to Waze.  Additional coordination with each technical partner during the steps of the testing process could help to identify the cause of service disruptions.

During the study, NJIT and iCone were unable to obtain Waze data showing how many people clicked the “thumbs up” to the message on the app. Future analysis should investigate how to gather reactions of the motoring public to Waze notifications. The researchers recommended exploring partnerships with crowdsourcing GPS navigation providers to further learn how drivers are reacting, which should include a data transfer process and strategies for reducing latency between iCone data server and Waze.

The Final Report contains additional information on the purpose of the research, the role of various stakeholder organizations in the research, a description of the technology devices and tools procured and used in the research, and the evaluation results.  The Final Report was submitted to the FHWA and is available to review here.

Featured Image Source: NJDOT, 2019.

Connected Vehicles Program Pilot Testing of Technology for Safety Service Patrol Workers Continues

Video screenshot of hazard display message received

The rise of crowdsourced navigation applications and connected vehicle applications provide new opportunities to relay road service safety information to the motoring public.  NJDOT has initiated a Connected Vehicle: Road Service Safety Message pilot study that evaluates the effectiveness of using connected vehicle technology to alert the motoring public to the presence of safety service workers at an incident site. NJDOT is piloting the use of a Beacon Hazard Lights technology to alert drivers to the presence of workers when safety service vehicles turn on their hazard lights. The piloting of the technology has received the support of the NJ State Innovation Council (NJ STIC) and a STIC Incentive Funding grant of $39,600 awarded by FHWA.

The primary objective behind the initiative is to inform the public of the presence of Safety Service Patrol (SSP) personnel thru various services and applications that share real-time traffic and roadway information once they have responded to an incident or to help a motorist.  A short demonstration video of how a technology-equipped NJDOT safety service vehicle interfaces with crowdsourcing platforms in the field can be accessed here.

Periodic interim reports for the pilot study are being prepared to evaluate the technology’s application during the STIC grant period. Previously, NJDOT and New Jersey Institute of Technology (NJIT) personnel conducted a field evaluation of the technology following the device-equipped SSP vehicle then subsequently maintained a data log of the device’s activity in the field and through mobile and web-based interfaces.  In continuation of this effort, the NJIT team proceeded with a similar analysis by studying the correlation between the data recorded via the device log and the crowdsourced navigation applications web-based interface. In addition, the radio logs maintained by the Safety Service Patrol were used to further support this evaluation effort.


New Jersey Pilots Connected Vehicles Program to Protect Safety Service Patrol Staff

NJDOT safety service patrol vehicle. Source: NJDOT

Each day New Jersey’s safety service patrol (SSP) workers put their own safety at risk to assist motorists in need and to assist other first responders. In addition to warning other motorists about recent traffic incidents, they remove disabled vehicles, provide gasoline, and perform vehicle repairs. Safety service patrol workers use temporary signage, traffic cones, flares, and portable variable message signs (PVMS), existing overhead message signs, the NJ511 phone and website systems as well as the SafeTrip application to warn motorists about their presence.

Unfortunately, collisions involving safety service patrol workers still occur. Cars often travel at excessive speeds near staff who work on the scene of such collisions. In 2015, the Federal Highway Administration (FHWA) reports that a work zone crash occurred once every 5.4 minutes in the United States. The impact of crashes can be catastrophic. Every day 70 work zone crashes occurred that resulted in at least one injury, while every week 12 work zone crashes occurred that resulted in at least one fatality. The NJDOT’s continued efforts to reduce work zone fatalities since the 1990s has resulted in one of the lowest rates in the nation. Despite this, at least one service worker has died in a New Jersey work zone each year since 2007. In 2016 seven fatal crashes occurred in New Jersey work zones, including the death of one service worker.

The automobile manufacturing industry is in the technology development phase of putting connected and automated systems fully in place.  Once deployed, first responders and/or their response vehicles would be detected by these systems to prevent crashes resulting from oncoming traffic.  Until those systems are deployed, the most used applications to alert motorists to roadside incidents, stopped police vehicles and other types of hazards is by Google, Waze, or HERE.

To help ensure the safety of service patrol staff, NJDOT has initiated a pilot study that will examine the effectiveness of using connected vehicle technology to alert the motoring public to the presence of safety service workers at an incident site. Starting in September 2018 NJDOT will pilot the use of a Beacon Hazard Lights technology to alert drivers to the presence of workers when safety service vehicles turn on their hazard lights. The piloting of the technology has received the support of the NJ State Innovation Council and a State Innovation Council Incentive Funding grant of $39,600 awarded by FHWA.  More information about the STIC Incentive Funding source can be found here.

According to Ross Scheckler, the managing partner of iCone, the product supplier for the hazard light technology to be piloted in the NJ study, the firm seeks to build technologies that will increase the availability of data about work zones to the traveling public.  Their tools alert drivers in real-time to the presence of workers, lane-closures and construction related back-ups by making them available on the cloud, where state traffic centers and navigations companies like HERE and Waze can pick them up.  A primary goal of the technology is to let drivers of vehicles know that the rescue truck or the flagger is in the road miles ahead so that the driver or the automation system can slow down and move over, or maybe choose a different route.

In the New Jersey pilot program, the iCone technology will transmit the location of worker vehicles within two minutes of the activation of a vehicle’s hazard lights. The location updates every 15 minutes and is re-transmitted if the vehicle moves more than 500 feet.

Data from 31 SSP vehicles will alert drivers via 511NJ as well as mapping & traffic apps

Thirty-one Safety Service Patrol (SSP) vehicles in Harding and Cherry Hill Yards will pilot iCone’s GPS technology to alert drivers using the 511NJ website and mapping, and traffic apps including Google Maps, Waze, and Here.  A Texas DOT study found that deploying iCone’s traffic beacons reduced crashes at a busy highway up to 45 percent (WorkZoneSafety.org). In addition, beacons deployed on roads resulted in crash cost reductions between $6,600 and $10,000 per night. Arlington is one of more than 450 partners including city, state and country government agencies, nonprofits and first responders to partner with the Waze Connected Citizen Partner program, a free data-share of publicly available traffic data, to deliver road and construction work information to cars.

Different states have used iCone’s technology in various ways, according to Mr. Sheckler. For example, Nevada has focused on relaying lane closures through iCone’s “Smart Arrow Board” modification product. Colorado on the other hand, has focused on the location of traffic cones around work zones through the ‘iPin’ product.  New Jersey’s initiative will examine the effectiveness of iCone’s technology on service patrol vehicles.

One benefit of the approach being tested is that the data appears to be comparatively low-cost and effective in reaching the traveling public through available traffic flow applications.  Mr. Scheckler, iCone’s product supplier representative, notes that most states can quickly accommodate to the data flow that the firm produces since the data feed is modeled off the Waze format.  “When states aren’t ready to integrate the data flow, the data still goes out to millions of cars through partners like Waze, HERE and Panasonic. This works so well that in states that haven’t started picking up the feed, we still have contractors using our equipment because they want their workers to show up in the car.”

iCone’s Vehicle Hazard Light Radio Adaptation GPS device. Source: iCone

In New Jersey, one of the program’s goals is to enhance awareness of the State’s Move Over Law enacted in 2009. The law requires a driver who sees an emergency safety vehicle to approach cautiously and, if possible, make a lane change into a lane not adjacent to the emergency vehicle. Emergency safety vehicles include those operated by fire or police departments, ambulance services, tow trucks and highway maintenance or emergency service vehicles, many of which display flashing yellow, amber or red lights. Drivers must create an empty lane of traffic or prepare to stop, if possible, or face fines of no less than $100 and a much as $500.

NJDOT plans to evaluate the success of the program during Year 1 and determine interest and opportunities for collaboration with transportation agencies in other states and first responder organizations. NJDOT is part of TRANSCOM (XCM), a coalition of 16 transportation and public safety agencies that improves communication and technology by the use of traffic and transportation management systems and in partnership with technology companies. XCM currently provides NJDOT incident data to Google, Waze, and Here as well as the 511NJ web and phone platform, however SSP vehicle location data is not integrated into any of these programs.

Sources:

Cowan, S. (2018). Spring 2018 STIC presentation: Connected Vehicle — Road Service Safety Messages. Retrieved from: https://www.njdottechtransfer.net/wp-content/uploads/2018/04/CIA-Team.pdf

Hsieh, E. Y., Ullman, G. L., Pesti, G., & Brydia, R. E. (2017). Effectiveness of End-of-Queue Warning Systems and Portable Rumble Strips on Lane Closure Crashes. Journal of Transportation Engineering, Part A: Systems, 143(11), 04017053. Retrieved from:  https://ascelibrary.org/doi/abs/10.1061/JTEPBS.0000084

National Work Zone Safety Information Clearinghouse. (c2016). 2016 New Jersey Work Zone Fatal Crashes and Fatalities. Retrieved from https://www.workzonesafety.org/crash-information/work-zone-fatal-crashes-fatalities/#new%20jersey

Ullman, G. L., Iragavarapu, V., & Brydia, R. E. (2016). Safety effects of portable end-of-queue warning system deployments at Texas work zones. Transportation Research Record: Journal of the Transportation Research Board, (2555), 46-52. Retrieved from https://doi.org/10.3141/2555-06