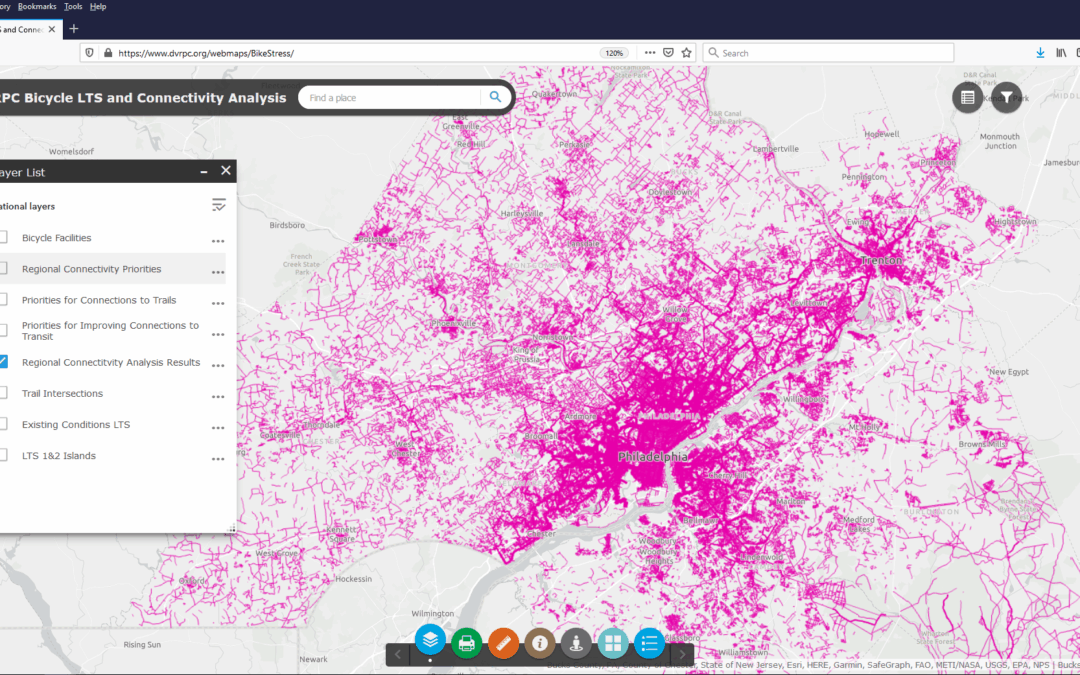
LTS-Connectivity-Analysis Feb 9, 2021 Figure 3. Regional map showing concentrations of connectivity between census blocks