Follow
Follow
Follow
Follow
Follow
NJDOT Technology Transfer
Research
Requests for Proposals
Research Projects
Research Showcase
Annual Implementation Reports
New Technology Evaluations
Innovation
Innovation Program
NJ State Transportation Innovation Council (STIC)
Every Day Counts (EDC)
Spotlight
Incentive Fund Requests
Accelerating Market Readiness Program
Training & Tools
Online Training
Knowledge Management Toolbox
Share Your Ideas
New Jersey Transportation Ideas
Build a Better Mousetrap
Resources
Library
News
Partners & Resources
Events
Calendar
Research Showcase
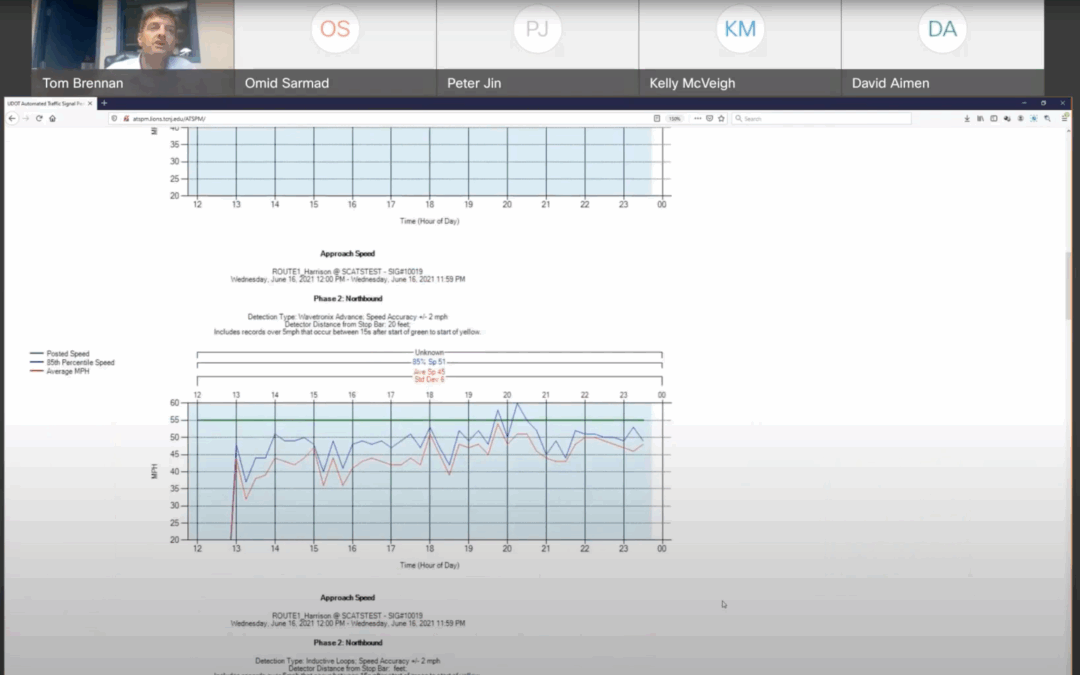
ATSPM Dashboard Demo
Jun 30, 2021